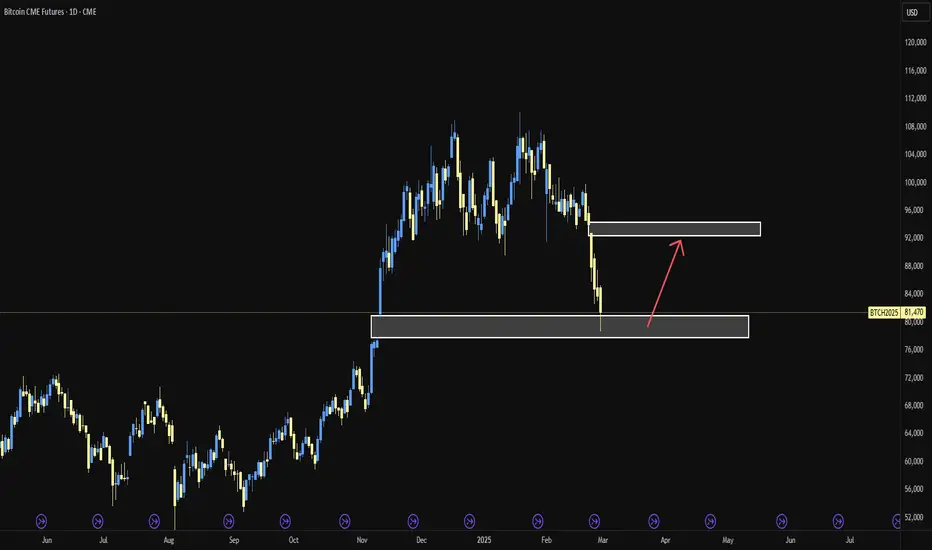
Bitcoin, Mind The Gap (85,720) The massive move initiated from Trumps tweet Sunday about the Crypto Strategic Reserve has left a massive gap on the Bitcoin Futures Chart. Gaps tend to get fill sooner rather than later, with a high 90% hit rate on gaps getting filled.
We could see a pullback this week to fill the gap with another run up following back above 90k to save the weekly close ... again.
We see confluence with the golden pocket (0.6128 - 0.65 Fib) here on that retracement and also the most amount of volume (VPVR) being traded there.
A final test of the demand below 90k, which if shown as support, will lead us back into the range of 90k to 110k.
BTCUSD18N2025 trade ideas

BTC CMEThe CME gap at 93k has been filled,but due to the announcement on sunday, wall street and CME bears got wrecked as TradFi was closed.

CYCLE 4 | CME GAP: Bull Cycle Period First Major Pull Back?Quick post to address BTCs expected potential first major pull back into this bull run period...
BULL MARKET PULL BACKS
Historically, BTC during its bull market enjoys pull back which ranged from 15% to as much as 30%-40% in prior markets. This is essential for trader participants in the market to take profits, allow BTC to retest low levels and prove new heights are sustainable before ranging to new higher price levels.
The first pull back historically for BTC post the start of the 'Bull Run' phase of BTCs 4 year cycle is traditionally the largest pull back opportunity and historically been the best short term buying opportunity in the Bull Run (NOT FINANCIAL ADVICE).
We can expect a 30-40% correction for this pull back based on historic bull market period examples (Let me know in the comments below if you would like me to detail consistent price behaviour during BTC bull run periods in a future post).
ARE WE AT THIS POINT NOW OF THE CYCLE? WHAT ARE THE INDICATORS SAYING?
As highlighted by the RED arrow on the chart, a number of the indicators like to monitor on the weekly chat are suggesting bearish divergences and fading momentum exists with the current price action. This is calling for a cooling off period of the market.
CME GAP
Historically, BTC has had a tendency to want to 'close' open gap, created by weekend trading of BTC that does not align with equities that follow the traditional 'No Trading' over the weekend policy of Traditional Financial instruments. Hence crypto ETFs which align with these policies (such as the CME Futures chart as seen in this chart) can create 'GAP' between the open (Monday) and close (Friday) candles.
To understand CME gaps, please take the time to review the details discussion in the earlier post.
The orange BOX shows the below CME gap target that BTC price may range towards to close.
NOTE: this box has been listed as Partially Closed as the open Monday candle of the gap did go below before rising during the weekly candle but did no dip past the close of the previous weekly candle.
21W EMA & 20W SMA
Historically, a fully developed healthy bull market for BTC has required periodic retesting and holding of these moving averages. A close of the CME gap at this point of the market would also satisfy this historic trend for BTC.
ORANGE TREND LINE
Bears if eager to continue the 'close the CME gap' trend will need to convince the market by first exceeding the orange trend line. Currently this allows BTC to complete a 10 to 12% correction while also taking the price below the key psychological 100K price level, without phasing the bulls conviction to charger higher.
* Holding the Orange Trend Line Scenario: we want to see price bounce and conviction from the bulls to push BTC to higher highs. The goal for Bears would be to achieve the measured move up to 180K. This would most potentially shorted the bull run (time prospective) and potentially cap our ATH for this cycle early; creating a distribution zone similar to the 2021 cycle top.
* Breaking below the Orange Trend Line Scenario: If we break the Orange Trend Line then Bulls will concede ground to the MA levels (allowing the CME gap to also close). Bulls will write this off as a market reset and holding support at these levels will entice Traders to take positions needed to drive BTC up sustainably to the next higher level(s).
Losing the MAs would ask serious questions to the intent of BULLs and the sustainability of the market moving forward this bull run.....

BTC1!Largest CME gap up ever. Interesting to see it open above 2/24 93,990 gap, and now backtest it from above to fill. Let's see if it can turn 93,990 into support now. Confluence with mid of yearly range...

BULL LOOKS PRETTY OVERAfter we had the gap at 78k, it closed as expected, and we saw a significant bounce. However, the bounce brought the price exactly to the gap at 93k xD. By the time CME opens tonight, the current price will have Bitcoin at 93k, creating a new, fairly large gap that will need to be closed between 84-93k.

"Bitcoin Filled the CME Gap – What’s Next?🚨 Boom! Bitcoin just did EXACTLY what
I predicted.
📌 The CME Gap at $92,695 - $93,790 is now completely filled!
📊 In My previous analysis, I highlighted the possibility of Bitcoin pushing towards this key level due to liquidity engineering. Now that the gap has been filled, the BIG question remains:
⚠️ Was this just a liquidity grab, or is Bitcoin gearing up for a massive breakout?
🔸 Scenario 1 - Bullish Continuation:
If BTC holds above $94K, we could see a push towards GETTEX:98K - $102K in the coming days.
Whales accumulating above this level could indicate further upside momentum.
🔹 Scenario 2 - Reversal & Liquidity Trap:
If BTC fails to hold above this level and starts closing below GETTEX:92K , this could be a classic fake breakout before another drop towards FWB:88K for a deeper retest.
💰 Key Levels to Watch:
🔹 Resistance: $94K | GETTEX:98K | $102K
🔸 Support: GETTEX:92K | FWB:88K | $84K
👀 Next Move:
A clear 4H or Daily close above $94K could confirm a continuation higher.
A rejection and close below GETTEX:92K might indicate a potential reversal.
📌 This was exactly what I predicted in My last analysis. If you missed it, check it out here:
🔗 Previous Analysis: Bitcoin Another Drop or the Biggest Market Trap?
🔥 This is a CRITICAL moment for Bitcoin. Are we about to see a true breakout, or was this just a perfectly engineered liquidity grab? Drop your thoughts below! 🚀👇
#Bitcoin #BTCUSD #Crypto #MarketManipulation #WhaleGames #Trading #LiquidityTrap #CMEGaps #CryptoBreakout #PriceAction

BTC update#BTC made a real nice rising wedge so the whole pattern was bearish and then the market made a big down spike to refill the GAP which was made in last uptrend market can rise from here or make another down to the demand zone and then make a huge rise !

BTCUSDT CMELike it? Based of of this post:
1.3 is 1.1 on CME. 1.0 bounce is a fib 1.0 from the last consolidation when the price was at 40k.
Work it out trend based fib extension. Ok, the 1st part is 22 Feb 2024 low. Fib is drawn from low to high to low. :)

Bitcoin: Another Drop or the Biggest Market Trap?🚨 Is Bitcoin’s decline a natural correction, or are we witnessing a masterfully engineered shakeout?
Bitcoin currently stands at a critical crossroad, leaving both retail traders and institutional investors in a state of uncertainty. To fully understand this moment, we must look beyond charts and price action—we must uncover the true forces at play.
🔍 The Hidden Forces Behind Bitcoin’s Volatility
From its inception, Bitcoin was seen as a decentralized revolution, but as it gained momentum, it also became a tool for financial anonymity. Over the years, untraceable payments to cartels, mercenary groups, and illicit networks forced global regulators to move from passive observation to active intervention.
Institutional money didn’t just fuel Bitcoin’s growth—it forced governments to rethink their stance. The Trump administration took a radical step, considering Bitcoin as a strategic reserve asset for the United States.
This wasn’t a random event—it was a carefully planned maneuver.
💣 The Trump Inauguration Pump-and-Dump: Market Manipulation at Its Finest
On Trump’s inauguration day, Bitcoin saw a violent pump, led initially by Binance, followed by Bybit and Coinbase, triggering an all-time high breakout.
However, this wasn’t a genuine breakout. Instead, it was a classic fakeout, designed to trigger mass FOMO, liquidate short positions, and set up liquidity for institutions.
🔹 Bybit initiated large-scale sell-offs
🔹 Binance and Coinbase followed suit
🔹 Bitcoin collapsed from its peak
To believe this was random is pure naïveté. Liquidity providers don’t act in isolation—they operate within a much larger framework of financial and political power.
📊 CME Futures: The Financial Gaps That Had to Be Filled
If you analyze the Chicago Mercantile Exchange (CME) Futures chart, you’ll notice multiple unfilled gaps, which indicate severe financial imbalances between spot and futures traders.
🔸 The 80,705 - 77,905 gap took 9 months to fill.
🔸 A new gap between 92,695 - 93,790 has now appeared.
These gaps are not accidental—they are byproducts of an engineered system designed to manipulate liquidity and correct imbalances.
📉 Bitcoin’s Support Levels & Why It Shouldn’t Drop Further
🔻 $75,000 is a crucial support level.
🔻 A temporary dip to $70,000 is possible but unlikely to hold.
🔻 A drop beyond $70,000 could lead to catastrophic financial turmoil:
⚠️ Mass liquidations worldwide
⚠️ Corporate bankruptcies
⚠️ Stock market collapses
⚠️ Institutional liquidity crises
This is why Bitcoin’s freefall must be controlled, and governments, exchanges, and major players will intervene before the damage spreads too far.
🚀 The Birth of a New Altcoin Season?
🔹 Traders are exhausted.
🔹 Bitcoin’s volatility has shaken confidence.
🔹 Capital is looking for alternative growth.
We may be witnessing an unprecedented event: the first altcoin season where altcoins move independently of Bitcoin’s influence.
🚀 If Bitcoin remains trapped in uncertainty, altcoins could decouple and establish their own market cycles.
But beware—this could be another orchestrated setup to drain liquidity before Bitcoin’s next move.
⚠️ The Perfect Short Squeeze Setup?
Markets have been flooded with short positions, driven by:
🔹 Fear & Pessimism
🔹 Institutional Manipulation
🔹 Lack of Retail Confidence
But what if this hopeless sentiment is the ideal setup for a market-shaking reversal?
Imagine a scenario where:
🔺 Bitcoin traps overleveraged shorts
🔺 Suddenly reverses with explosive momentum
🔺 Traders who expected further decline get liquidated
We’ve seen this happen before.
The question is—who will be caught off guard this time?
📢 What Do You Think? Comment Below!
💬 Is Bitcoin heading for another major dump or a massive short squeeze?
💬 Will altcoins finally move independently of Bitcoin?
💬 Are we seeing a government-controlled Bitcoin strategy unfold?
🔥 If this analysis was insightful, don’t forget to like & follow for more deep market insights!
With respect,
Hamid
#Bitcoin #Crypto #CryptoMarket #Altcoins #Blockchain #CryptoNews
#TechnicalAnalysis #TradingView #CryptoTrading #PriceAction #MarketAnalysis #BTCChart #CryptoSignals
#BitcoinManipulation #WhaleGames #CMEGap #InstitutionalInvestors #MarketLiquidity #ShortSqueeze #Altseason

Bitcoin: Short into the Real Bull Market Market sentiment has plummeted to unprecedented lows as Bitcoin approaches critical support zones around the $80K level, coinciding with the CME futures gap.
While I have outlined a potential bullish scenario, I remain cognizant of the significant downside risks. A sharp decline could unfold, instilling widespread fear among market participants before the true bull market takes shape.
Above, I have illustrated a bullish harmonic pattern, a structure characterized by price contraction followed by an eventual expansion. This formation suggests a retracement to the 0.618 Fibonacci levels of both the prevailing uptrend and the resistance formed by the downtrend.
What particularly draws my attention is the positioning of the Point of Control (POC)—the most actively traded price within the previous range. This key level represents an area where price may face rejection from the broader value zone.
From a psychological standpoint, such a move would create an illusion of stability as Bitcoin retraces toward the $96K– GETTEX:98K region, enticing investors who anticipate a break above $100K and a push toward new all-time highs. However, this very zone could serve as a major liquidity exit point for larger players looking to offload positions and potentially establish short positions against the market.
Should this scenario materialize, the likelihood of the harmonic pattern playing out increases, potentially leading to the loss of the value area and forcing Bitcoin to revisit previously established support, where it traded in the value area around the $60K range.
This sharp decline would likely convince many that the bull market has ended, triggering an influx of short positions. However, such a setup could ultimately serve as a bear trap, culminating in a dramatic short squeeze and marking the true inception of the next bull run.
A decisive reclaim above the POC and key confluence zones would significantly enhance the probability of revisiting all-time highs. Nonetheless, I will be closely monitoring the critical levels detailed in my journal for signs of a broader market reversal.
Only time will tell...

BITCOIN FILLED CME GAPToday BTC might have bounced-off a 5 months away gap.
OPPORTUNITY :
Ideal buy was in the now filled CME GAP.
We might revisit these price, so 79100$ remain a good spot for a BUY/LONG alert.
General buy zone is from 72.5k$ to 85k$ and should last until approximately mid April .
TARGETS :
Ideal sell would be 136425$ in late July (23/07).
Probable sell zone go from 130k$ to 160k$ and should span from early June to early August .
MAXIMAL $ TARGET :
- There is still a chance for a powerful leg up, in the event of prices nearing 200k$ , profit will have to be taken regularly and without restraint.
MINIMAL $ TARGET :
- A faillure to break above last ATH, so 110k$ is definitely a partial sell price (and will react).
MAXIMAL time TARGET :
- All positions (including altcoins) should be closed before October 2025.
Based on
Chart Tools :
- Fibonacci levels from Retracement and Extension
- Expansion/Consolidation periods durations tendencies from this bullrun
- Regression over time of said periods
- Percent change of said Expansions periods
Statistical Arguments :
- Past Bitcoin cycles (2016 & 2021) general seasonality
- Coinglass's Bull-Market-Peak-Signals had 0/30 indicators showing a top
Fundamentals :
- Optimistic US inflation
- Peace negociations
- Pro-business policies
- Blockchain technology usage growth
- Bitcoin & major crypto adoption in finance
Bias :
- Up-trend intact
- No hard corrections compared to previous bullrun
- I guess i could use some profit

BTC Finally Up From Here? Bitcoin has faced significant headwinds recently, experiencing a nearly 30% decline from its all-time high, instilling widespread fear and uncertainty across the market. With the Fear and Greed Index plummeting to its lowest level in the past year, the key question arises: are we approaching a pivotal inflection point, or is this the beginning of the end for the current bull cycle?
There are several compelling reasons to believe that the uptrend may persist from this juncture:
Market Structure & Elliott Wave Analysis
The prevailing market structure suggests a higher probability of a corrective phase rather than a definitive trend reversal. Historically, corrective movements tend to retrace back to their origin, implying a potential rotation toward previous highs. Furthermore, Elliott Wave theory identifies Fibonacci extension levels as key termination zones for corrections, with the most common being the 1.0x and 1.618x extensions. Notably, Bitcoin has precisely touched the 1.618 extension, reinforcing the possibility of a structural rebound.
CME Gap & Liquidity Injection
A critical CME gap has now been filled, which could catalyze fresh liquidity inflows from sidelined capital. This is further evidenced by the formation of a substantial buyer wick on the daily candle, suggesting renewed interest and accumulation at these levels.
Anchored VWAP & Market Strength
The anchored VWAP from the August range low—marking the inception of Bitcoin’s 100% upward move—appears to be in the process of reclamation. If successfully held, this could signal a significant resurgence in market strength, providing a solid foundation for further upside momentum.
Should Bitcoin manage to reclaim its all-time high heading into the summer months, it could pave the way for an extended bullish continuation. However, as always, only time will reveal the ultimate trajectory.

BTC will fill CME GAP at around 77KWe're seeing some wild swings in Bitcoin's price, and I'm calling it: this isn't just the market doing its thing. I mean, where's all the BTC on exchanges? It's like there's none left, and the prices are shooting up to levels that Wall Street boys would think twice about jumping into.
This smells like big-time manipulation by the heavy hitters, like those hedge fund giants and the exchanges themselves. They've got the power to make the market dance, and with so little Bitcoin floating around, every move they make has an outsized impact. It's like they're playing with a loaded deck.
I'm not saying I've got the smoking gun, but the signs are there. When you see prices that don't match the supply, you gotta wonder, right? Are we just pawns in their game, or is there something else at play?
Let's keep our eyes peeled, because if this is manipulation, it's on a whole new level. What do you guys think? Am I onto something, or am I just seeing shadows?
Remember, this is speculative based on what we're observing in the market, and while manipulation is a concern, it's one among many factors influencing crypto prices.
Whats your thouhts?

BTC CME GAP
- A new gap was created this weekend on the CME.
- BTC's price is higher there, which is typical.
- A gap isn’t always filled; while many do eventually close as prices retrace, it’s never guaranteed.
- This isn’t a price analysis, but rather an alert to monitor the gap.
- I’ll add my previous gap analysis in the comments.
Happy Tr4Ding

Either this is dip or we are in bear marketCRYPTOCAP:BTC CME gap is nearly filled (ends at 77,930, bounced at 78,675). It also tested the 10-month MA (76K). Monthly RSI is at support, similar to August 2024, when price surged from 49K to 110K. There are several indicators tested such as distance to 50 day moving average as well as 200 day moving average current price. As long as it holds above 75-76K, the bull market remains intact.

BTC 160K in JulySimple fractal from last year summer doldrums on the the BTC chart.
Once we corrected to the 200 SMA (current spot) , a 2 month bottom consolidation followed and after 2 months, BTC reached all time high. That is my thesis going forward and it bodes well with the US new administration typical down turn within the first 100 days of taking office. Fed still tightening, rates still high, etc
Congruent also with a shift to an increase in global liquidity and lower rates incoming towards the summer, as the US economy is now showing obvious signs of weakness.
My 2 cents.

Btc cme gapBeen waiting for the Cme futures gap to be filled.For those who follow cme gaps know that they always get filled and price bounces from there. Also ma200 is below the gap which is a very good support and price should bounce from the ma200 lets see what happens 👀🚀

General Market Analysis - SMC Point of ViewIn this video I go through an analysis of DXY, EURUSD, USDCHF, OIL, and BTC. I also delve into why I think some short-term manipulation is happening and share my narrative.
I am not fond of giving a long description here when I give my analysis in the video, so please enjoy and share your thoughts.
- R2F Trading

Bitcon currently filling the CME futures gapWe knew it was likely this would happen at some point in the near future from when the gap was formed and it appears like now is the time. Price action needs to dip as low as $77,920to fill the gap entirely. History tells us the correction should be over with not long after the gap is filled. The only way this isn’t the case is if the top of the bull market was indeed already in, which is a very minute probability but not impossible. *not financial advice*

BITCOIN CME FORCASTIf CRYPTOCAP:BTC Dropped 🐻 Below $80k then Expect a good Bounce from $78k.
CRYPTOCAP:BTC Buy 🦖 Limit Orders
● $80500
● $78k

Will the bitcoin bloodbath send prices below its 200-day SMA?Currently lower for a sixth day, bitcoin futures have just tested the 200-day average for the first time this year. This clearly marks a pivotal moment for bulls and bears over the near term, but we also have to factor in the higher timeframes.
Matt Simpson, Market Analyst at City Index and Forex.com

Bitcoin Futures in Freefall !!Bitcoin Futures in Freefall: Navigating the Stormy Crypto Seas
As of February 27, 2025, Bitcoin futures have been experiencing significant volatility, reflecting the broader trends in the cryptocurrency market. The current price of Bitcoin futures on the CME (Chicago Mercantile Exchange) is approximately $84,945, which represents a notable decline from recent highs.
Market Overview
The cryptocurrency market has been under pressure due to a combination of factors, including regulatory uncertainties, macroeconomic conditions, and market sentiment. Bitcoin, being the flagship cryptocurrency, often sets the tone for the entire market. The recent drop in Bitcoin futures prices can be attributed to several key factors:
Regulatory Concerns: Governments and regulatory bodies worldwide have been tightening their stance on cryptocurrencies. This has led to increased scrutiny and potential regulatory actions, causing uncertainty among investors.
Macroeconomic Factors: The global economic environment, including inflation concerns and interest rate hikes, has impacted risk assets, including cryptocurrencies. Investors are becoming more cautious, leading to reduced demand for Bitcoin futures.
Market Sentiment: The overall sentiment in the cryptocurrency market has been bearish, with many investors adopting a risk-off approach. This has resulted in increased selling pressure and lower prices for Bitcoin futures.
Technical Analysis
From a technical perspective, Bitcoin futures have broken several key support levels, indicating a bearish trend. The price has entered a fair value gap (FVG) and is approaching an order block (OB), which could act as a support level. If the price finds support at the order block, there could be a potential reversal or consolidation before any further movement. However, if the price breaks below the order block, it could indicate further downside potential.
Future Outlook
The future outlook for Bitcoin futures remains uncertain, with several potential scenarios:
Regulatory Clarity: If regulatory bodies provide clear guidelines and frameworks for cryptocurrencies, it could boost investor confidence and lead to a recovery in Bitcoin futures prices.
Macroeconomic Stability: Improvements in the global economic environment, such as controlled inflation and stable interest rates, could positively impact risk assets, including Bitcoin futures.
Market Sentiment Shift: A shift in market sentiment towards a more bullish outlook could lead to increased demand for Bitcoin futures and higher prices.
Conclusion
In conclusion, the current situation with Bitcoin futures is characterized by significant volatility and uncertainty. Investors should closely monitor regulatory developments, macroeconomic conditions, and market sentiment to make informed decisions. While the short-term outlook may be bearish, there are potential catalysts that could lead to a recovery in the future.
