OMGBTC - Bullish signsOMGBTC currently at previous resistance area but volume indicator shows signs of bullish accumulation. Potential buy opportunity with targets at 1.618 @ previous accumulation area and 2.618 fibonacci extension.
OMGBTC trade ideas


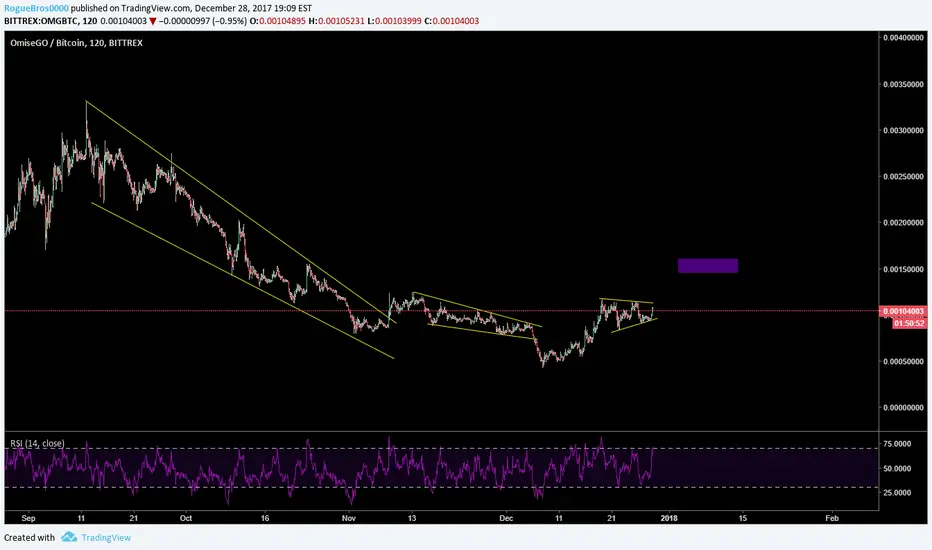
Omg/btc buy opportunity Omg is forming a triangle , you could buy at support to break of resistance . DYOR, Just what I see the charting telling me


OMGBTC - Hold Hold HoldOMG (Omise) - Global remittance and payroll + payment gateway & exchange token
Bullish Indicators:
-MACD crossover
-TD Sequential "1"
-Triangle breakout
-Bull Flag
SDK Wallet releasing in Q1 with big partners being announced soon. OMG will look to be one of the first mainstream coins with real adoption and use cases in 2018.
Expect big action.
Ack! Clif High December Report - "The data sets continue to grow in support for OMG and 'new opportunities' that are going to be 'touted (made visible in media)' over the last of Winter (northern hemisphere) such that by late February, OMG is seen as a 'leader' in the Spring. There continues to be growth in sets for OMG to be gaining over 2018 through well into 2019, with some sets describing OMG as a 'leader' in the larger group of rising coins/tokens from the 'Spring (northern hemisphere) ramp up'."
Targets
Short/Med Term:
- $32
- $65
Longer Term:
- $98
- $120

OMG Ascending Triangle> Clearly in an ascending triangle formation.
> Will see a similar breakout to previous if volume grows.

OMG Omisego trying to breakoutOMG trying to breakout of daily resistance, following up trend support.
Without any news (coinmarketcal.com) but volume is increasing in bittrex.
I expected OMG to at least go to my target 1.
Safe buy is around .00095

OmG It appears that OMG as broke out of an inverse head and shoulders pattern and looks to move toward the .618 Fibbonaci extension levels.
We can also see that the daily MACD has crossed and that the RSI levels are prime for lift off, especially when the daily closes above the cloud!
Cheers and happy trading!

OMG Uptrend BeginsOMG has broken the downtrend with a large impulsive wave possibly wave 1 has not completed yet..

OmiseGO$OMG is sitting on trending support above the Daily cloud, should get a continuation to the blue box target at .00185

OMG is bullishLooks like OMG/BTC is doing a reversal & RSI is showing a bullish divergence
Buy if breaks 116k-117k
Stop loss is 85k
Our main target is 170k anyway you can sell where you want
Note: Trade at your own risk, this is an especulation.


OMG (if BTC allows)Hidden divergence while forming an ascending triangle into the ichi cloud with a strong case for TK cross.
Buy zone = Triangle support
OMG looks strong in early 2018.
New to TA, here to learn, Critiques welcomed


OMG/BTC - Long over 116k satoshiOMG had a nice run up back in August to all time highs. It's gradually scaled back since with a more than 75% pullback and found a solid support floor around 45k satoshi.
We've seen a quick break out with support riding along the 50 day moving average. I'll be watching out for consolidation above the 50 day moving average into the bullish flag that's forming.
First Buy: 116k satoshi
Second Buy: 120k satoshi
Stop-Loss: 89k satoshi
Target #1: 200k satoshi
Target #2: 260k satoshi
Target #3: 290k satoshi

OMG Trending Nicely - LTSolid LT play backed by a solid company already doing their thing. They don't over promote their coin as they have yet to release their mainnet but I expect big moves to the upside when to do.

OMG BuysDuring our live trading session we took a buy on OMG in the 10300 range. Spacing buys between 10,000 and 10,300. 1st target of 16000 and end target of 21,000


OmiseGO Long IdeaBuy zones and Refill zones in the chart.
Don’t forget the past, learn from it. Happy New Year.

OmG is on it's way.. To Heaven ?I expect formation of a HANDLE and consequent impulse towards the Pressure Line as a continuation of a larger triangle trend.
The Long trend is beautifully embedded within a Sine Wave womb and about to hatch on the first weekend of 2018.
My plan is to benefit from short position on impulse towards pressure line and eventually on long position after price breaks out around the Conclusion Point .
I see beauty in composition of this chart, in particular the coincidence of sine-wave intersection with the tip of the pennant in what i call Conclusion Point .
This captures my attention and compells me to invest. Am I silly ?
This is my first ever published idea, and I'm very new to trading and TA ( it's vocabulary also) in general, so please excuse my potential inaccuracies.
I will appreciate any feedback.
Thank you

OmiseGO long - bullish signalsI see a bullish triangle that's about to breakout soon. Price bounced from the kumo cloud which is a bullish sign. Volume decreasing and it might lead to a big boom in volume soon. Tenkan is also above kijun which is also bullish. MACD and RSI looking to recover. Buy when it breaks the triangle convincingly.
If you like my analysis consider following me on twitter: www.twitter.com