OmiseGO trading the rangeOMG shows indecision candles at critical pivot point within a consolidation range. All of these indicates bullish reversal signals. Entry and target as shown. GL
OMGBTC trade ideas

Wait 13th bar for TD Countdown complete to go up.It's just 1 bar to TD Countdown complete.
Entry at 13th (close <= low before 2 bar and <= 8th)

omg btcomg on elliot wave 2.
23.6 support level, could expect a bounce from there onward to elliot wave 3

OMG - heading towards 0.00084 btc??OMG is showing still in correction mode. Weekly candles show a stronger picture of trend, and I don't see any news coming up that would reverse it until we hit next zone of support (high probability). What do you guys think? Buying the dip?

OMG - Reached old trendlineThe 4h chart shows and oversold market, RSI crossed but the MACD indicator is still pointing downwards. The dip closed inside of the Bollinger Bands and the breakout closed above. We are currently heading towards the bullish trendline, maybe influenced by the BTC-Amazon-Story.
Daily chart shows that the MACD indicator is crossing for the first time after the major correction. The volume stopped decreasing and is now remaining stable.
Wait for a clear bounce or buy in early for max. Profit.
Good buy signals would be a clear bounce with a crossing MACD indicator.

OmiseGO OMG preparing to exit downtrend for Bullish breakoutIt seems OMISEGO coin is now at the end of it's bearish pattern and is preparing for launch in a bullish trend after breakout of structure. Ketchup EMA has crossed the Water EMA as well as the price action touching the 70.5 Fibo Sweet Spot. TDI shows the RSI close to oversold position and I'm expecting a small move up, then down to create a sharkfin on the TDI outerband, before the breakout of structure and the cros of the Ketchup with the Water EMAs, where I will buy more of this coin.
----------------------------------------------------------------------------------------------------------------------------------------------------------
DISCLAIMER: This chart is for sharing and educational purposes only and is not intended to be a signal service or similar.
This chart analysis is only provided as my own opinion, based on my own analysis and comes with absolutely no warranty that this analysis is correct, whatsoever. Do not trade this chart if you do not have your own strategy. Trade only with your own strategy at your own risk. Plan your trade and trade your plan... and IF in doubt, stay out.
.....::::: If you like this chart, please click on the THUMBS UP! :::::.....
----------------------------------------------------------------------------------------------------------------------------------------------------------

OMG/BTC: Market CyclesIt is not the time for going long on OMG. Profits should be taken from latest bounce.
RSI on daily is showing oversold and a bullish divergence, indicating we could begin trending sideways. Upward trend is highly unlikely. Most alts reverse after 90% retracement.
I am favoring scenario 1 because of the RSI, followed with a continuation of the downtrend. However, with segwit 2x coming in less than a month we have a big unanswered question over the entire market which could be bearish for BTC and alts. Scenario 2 is a possibility.

RSI 34OMG on the path to hit previous strong support (Line A) on 1 day chart. I think it will hit below 100k if current support of 115k sats breaks.
We can confirm short-med term uptrend if it crosses Line B and C. I suggest to consider current BTC price and its direction before entering to OMG.


OMGBTC OmiseGo. Buy Opportunity.I see OMGBTC price at demand zone and it's a good opportunity to buy it. It has passed 4 Fib levels and now it's on last one. Williams R% at lowest level and the only exit is upward movement. My idea is to buy OmiseGo at white zone and sell it at end of upward arrow. Don't forget about stop-loss lower than white zone. Good Luck !

OMG & BTC TRADEBTC TO BOUNCE REBOUND RESISTANCE, OMG TO BOUNCE SUPPORT.
OMG VARIES INVERSELY W/ BTC
OMG trend analysis inspired by : EXCAVO .
:)


OMG sell scenario.Looks like omg lost some steam, this is my close target, then i most propably reduce my stack.

OMG 1-day looking greatOn the one day chart Omg has made an almost perfect 61% retracement where it has created it's new floor. With the MACD starting to shift upwards I think sometime within the next month we will begin to see Omg start to climb again. With that said, I think we are at a very nice entry point for this strong project. Within the next couple of weeks it will be meeting a pressure point and we will see some confidence rebuilding around Omg when it breaks this sideways movement.

OMGBTC normalizing before upward spiralOMGBTC is creating a stable support at 130000 satoshis. We will know more once the payment system becomes reality.

OMG - getting close to a bounceOMG - getting close to a bounce. Could consolidate for a while. What do you guys think?

OMGBTC Bittrex. Rollback 50% FIBO - 22% profitSince this asset is reduced with rollbacks through FIBO channels, there is a possibility that the next pullback in the upside is possible from 50% of FIBO

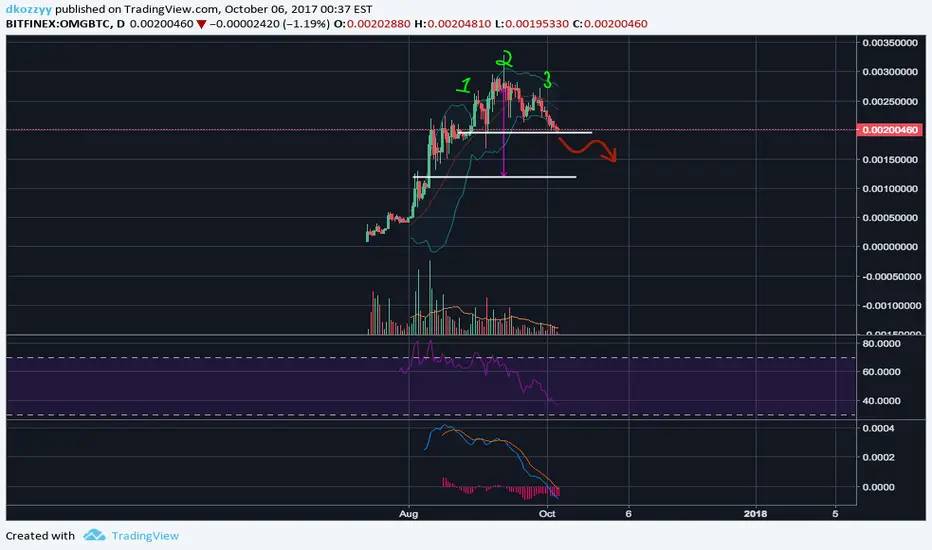
OMGBTC Head & Shoulders PatternHello all,
What do you think of this Head & Shoulder pattern on OmiseGo? Could OMG be headed to .0012BTC?
All comments, thoughts are welcome.
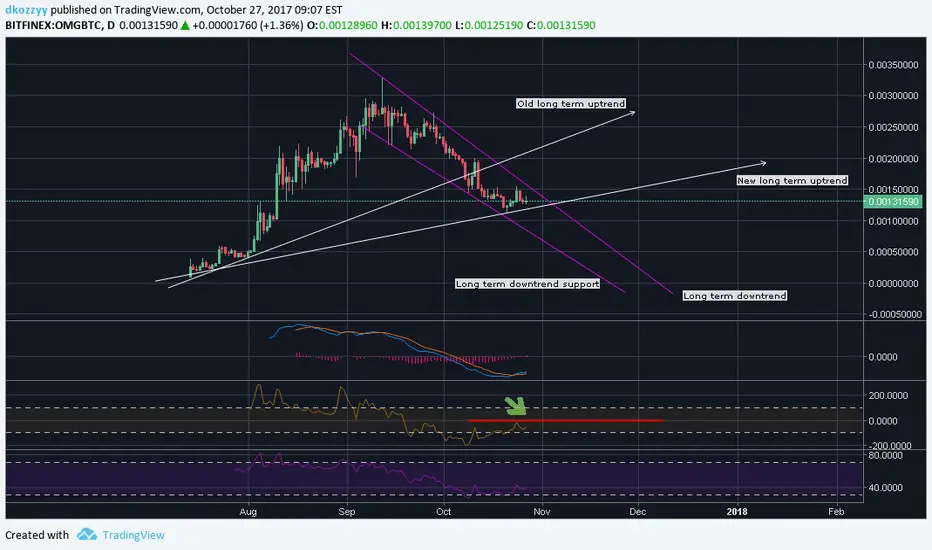
OMGBTC - Potential Uptrend AppearingThis is a follow up to my post about OMG's Head & Shoulder Pattern from 10/05/17. As you can see from my original post, OMG did reach target of .0012 (slightly below actually) and has since bounced pretty nicely, even reaching .00155BTC.
I'm not convinced we are in an uptrend yet. I still think we need a week or so to confirm. I'm of the belief we will see BTC reach 6,300 before the alts begin their resurgence. However, a couple things I will be keeping an eye on with regard to OMG:
1. Do not break new long term uptrend support line. If break, will trade between long term downtrend lines to about .001BTC with remote possibility of reaching .0005BTC if volume continues to decrease.
2. A close above the CCI zero barrier. This is the red line I'm pointing to with the arrow. A cross and close above this line will be my third and final indication that we are truly in an uptrend. This is the key factor I will be looking at. ***NOTE*** I typically wait a day or two for the CCI to close above the zero barrier multiple times as a reconfirmation of the uptrend.
Here's to going long!
OMG reboundOMG found very strong support around 0.0014 and should be able to start a new run from there with an interesting first resistance level around 0.0020 where it could also meet the MA 50.

OMG looks ready.Similar cloud setup to ZEC, waiting for the candle to close in the cloud. TK already flipped bullish, bullish diversion on rsi and macd is flipping up. Stop set and bottom of cloud support, first target top of cloud. Although with partnerships and the roadmap release today, I expect a kumo breakout to take it much higher. A lot of charts are shaping up, all dependent on btc of course. A slow steady slide downwards for btc and these charts will manifest, a massive dump will likely drag these down as well. Best of luck!

OMG Long NowOMG looks like it could make a break up when the downtrend meets support, multiple bounces off our support has been confirmed in the past so OmiseGo should have the potential soon. Look to buy now and sell when reaching ATH's. expect multiple pullbacks along the way, swing traders can benefit heavily from this. expect ATH's by the end of November to mid December. good luck trading
