OMG idea
1D Price bouncing from Bollinger Band pinch & RSI heading downward
MACD bull cross and gaining momentum
4H testing Bollinger Band MA support
RSI & MACD bullish
If we can break this wedge we will retest 159 & 174
If not look to the orange box - also watch BTC Price action
OMGBTC trade ideas

OMISEGO: NEW PARTNERSHIPS & EXCHANGE LISTINGS - PROFIT = 19.14% Our "Crypto Bottom" Trade Indicator has correctly identified a buy in point on the 29th of May 2018 .
Using this buy in point and selling at today's peak price as identified by our NEW "Crypto Peak" Trade Indicator, you would have expected to net 19.14% PROFIT!!!
The increase in price may also be explained by positive developments including:
September 5 2017: Omise partners with McDonald’s Thailand to provide seamless payment experience for online and mobile orders
5th April: Omise and OmiseGO sign a Memorandum of Understanding with ShinhanCard (a subsidiary of Shinhan Financial Group, a major player in South Korea’s banking and payments arena). This aims to identify opportunities to leverage OmiseGo's payment technology and solutions, and OmiseGO’s server and mobile SDKs
26th April: The OmiseGo cryptocurrency lists on the Bithumb (one of Korea's largest exchanges by volume ).
(NEW) April 26: Zebpay lists Omise Go.
(New) May 14: London Block Exchange lists Omise Go. It is the only exchange in London to provide Great British Pound trading pair.
(New) May 14: Omisego team signed an agreement with Shinhan and Woori (two major South Korean bank). Both banks will work on Omisego’s Blockchain to ease financial transactions.
(New) May 23: Unicoin (India's top cryptocurrency exchange) lists Omise Go.
The general uptrend in the crypto markets as well as the positive developments outlined above.
***The "Crypto Bottom Signal" and "Crypto Peak Signal" used in this analysis is included as part of the Crypto Trade Signals subscription.***

OMG on the way upMonth to month trend, MACD, RSI and support lines suggest $OMG is gonna have a good month!

OMG TRENDING UP | Soon MoonOMG TRENDING UP | Soon Moon
Golden Cross On Macd
RSI Slowly Turning Bullish
#Altseason

OMG will have a moon ride anytime soon!Looking solid!
buy 0.00140-142
sell 0.00155
0.00199
0.00243
0.00311
Stoploss:: 0.00112

OMGBTC (OMISEGO Token) Ready, Set…………..!OMGBTC (OMISEGO Token) 05/26/18, 8:15 PM EST, by Mike Mansfield
Good evening, trader friends! Thanks for stopping by. No, no, no, I am not here to wrangle a thumbs up from you on this one. However, if you just love any of the other forecasts, feel free to like away! ;-)
OMISEGO sounds a bit like what “oh my gosh” would be in another language.
Perhaps you can relate to the following statement: "Sometimes I literally “know” what an outcome of a chart will be with a high degree of clarity, probability, and ultimately accuracy." However, this is not one of those times. I can rationally make the case for several outcomes. That is not something I love….but since someone asked for this, I’ll map out the 3 patterns and their likely paths and change of trend times and price areas to watch for.
BOTTOM LINE: UG! We have patterns within patterns, but the cycles look good!
Pattern-1 is long-term neutral:
Large triangle wedge pattern (lime green and dark red lines) may be forming. If correct, it is unfinished and will have at least one, possibly two, more legs down toward the red long-term support trend trend-line, before we can say for sure if the pattern will resolve to the upside and moonshot, or tank into crypto oblivion.
Pattern-2 is medium-term bearish. Maybe:
Bearish rising wedge (cyan blue trend-lines) lines are converging in an upward direction. But it’s not super perfect pattern, as they sometimes look. Rising wedges typically resolves to the downside in a significant way. Moreover, OMG broke the lower support line at the recent May 23 low, which likely means eventually lower prices.
Pattern-3 is short-term bullish:
Falling wedge (yellow downward trend-lines) is short-term bullish and no matter what,
a cyclical bounce is due now based on the two quite accurate cycles thus far.
CYCLES:
Two nicely aligning cycles lows are nesting now (making a low). OMG should have a tradable rally to the green downtrend line.
Green cycle moving up and due to peak June 18,
Green cycle bottoms again July 15th.
Pink cycle is also moving up. Both the pink and green cycle are both due to top around August 10 also, =/- 2 days.
INDICATORS:
Klinger Volume Force is in a wedge. It also supports the idea that the eventual breakout, up or down, should be big.
MACD is rounding in line with cycle lows due any day now.
SUMMARY:
Short-term pattern and cyclical are bullish for a bounce, or more, perhaps until mid June.
Then, another selloff back to the lower cyan support trend-line, in alignment with the cycle low of the shorter-term green cycle, while the larger pink cycle is
moving up.
OMG with then either breakout the upside in line with the pink cycle moving up until about August 10th, while the pink longer-term cycle is also moving up and
blast off.
If the breakout does not happen by the peak of the Pink cycle (Aug 10th), then OMG is very bearish, and the bigger triangle/wedge will likely end badly for OMG.
If OMG breaks out to the upside between now and June 18th, then it might retest the breakout line or pullback around July 15th then have a cyclical peak
August 10th +/- 2 days.
POTENTIAL TRADE:
Consider looking for a short-term cyclical long trade. Lower risk area could be at the first higher swing low once a 34-50 bar EMA
average (or something better) turns up and price is also closing above the average. If The trade doesn't move nicely after the first or second pullback on a 240 minute chart, then the outlooks would be quite bearish short-term and long-term.
DISCLOSURE:
This analysis is meant for educational purposes only. You trade at your own risk!
Cheers!
Michael Mansfield CIO


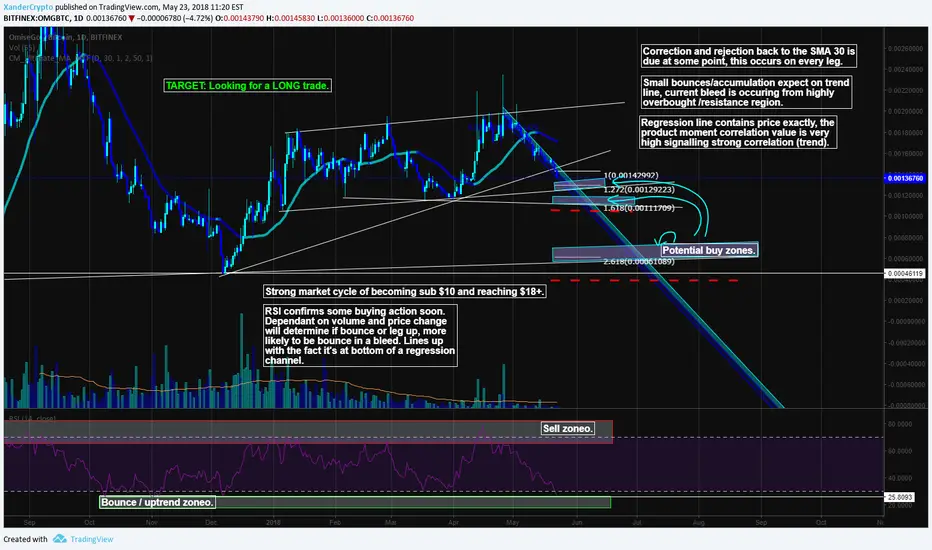
OmiseGO, a Mid - Longterm analysis [OMG/BTC]A Mid-Longterm look on OMG/BTC
One of my favourite projects, with a cyclic nature will hit back soon. A common cycle is sub $10, then above the $18+ region.
Here we want to pick up OMG around a support region after it has some good buyback volume after selling volume thins or shakeout occurs.
In this trade I use:
~SMA 30.
~Trendlines.
~Horizontal support lines.
~Volume for confirmation of bleed.
~RSI.
~Fibonacci retracement to line up with targets of trendlines / to see if these regions naturally occur.
~Stoploss / sell zone on a fakeout of a buy in.
Want to join a private trading group?
PM me.
This is NOT a buy OR a sell signal. I'm not a financial adviser and nothing I say is a fact, any losses made through these decisions do not hold me accountable and you should never invest more than you're willing to lose.
Thanks for reading, a follow on tradingview and a like would be greatly appreciated.
1k followers ~ FACE REVEAL
Xander
OMG to go up sure shot! Trade active, risk low!Just check out the repeating pattern being formed! History shows us the way!

$OMG We're going down for a bit - New support lineFollow the Dark blue line. That's the new support line. Got it? Good.

My thoughts on Omisegoomg is curently finishing up its c wave from its abc correction and will be looking to move up after it and commence an impulse wave up as long as btc doesn't mess it up. Short then long.
Let me know what you think. thanks.

OMG flags, wedges, and double bottoms!Price is forming a falling wedge/flag and has broken through the bottom of the kumo.
Although, Senkou lines have weakened near 6/16~
Stochastic RSI forming a double bottom
MACD confirming very oversold conditions.
The current horizontal movement of the Kijun/Tenkan show that the downward momentum has begun to slow down.

10xFold or $130 this year, but first we have to hit $33.We are in the ascending Wedge starting 2018, and it looks the price is about to hit base A, so if there was a time to enter this is it.
We still need to have ABC to finish with a leg C to give us the director of the trend, so III is just a hypothetical point without a direction, and same goes for IV.
/*This information is not a recommendation to buy or sell. It is to be used for educational purposes only.*/
If you want your coin to be analysed, please PM me.
Thank you,
Ajion

omisego teasinghi, omisego is teasing me tbh. i like when charts has a dip with volume that doesent make new lows (Current candle). its as if someone is absorbing the sells - could be an insider, could be because of public news, who knows (i havent checked). But it could be the start of something good if you go long. Lets see.

OMG 30m about to break out, yet careful.I am mostly long on this position, it might have the long moon-breakout soon, this would be a good starting point for it to do so. Anyhow, I would still watch the price carefully and it breaks the support, it will have another retracement. Keep in mind the bullish forecast for BTC in May every year after consensus. This could break the resistance. Apart from that RSI seems to have formed a double bottom and Bollinger Bands look to get closer.

OmiseGo could give us some satoshiAs OMG is a proper project, and TA is pointing well for it, i think in the very near future we can except price going to resistance level.

Just an explanation of whats going on with OMGOmisego currently finished its 5 downward impulse waves and is in an abc correction, i believe a longer abc correction is going to happen and we will spiral even more down after the correction, either forming an additional abc, abcde or simply the start of a new downwards elliott wave. Everything im looking at says short until btc start behaving again.
Thanks and let me know what you think. :)

OMG: NOW OR LATERASCENDING TRIANGLE
STRONG RESISTANCE
RSI IS ON SUPPORT
T1: 2219 SATS
T2: 2731 SATS
T3: 3155 SATS ASCENDING TRIANGLE TARGET
S1: 1500
DYOR


OMGBTC not time to buy yetIt finished the 0.618 retracement and even cont retracing more. The first support level broken, so now heading to the second lower one. It increased from Apr to early May, so it is expected to retrace more to the green flag sign. That's where, I think, we should buy in.

$OMG Bull-Run Beginning! Pennant over #OmiseGO long awaited MoonI've been following OmiseGO for a long time. OMG has top fundamentals and has had a steady growth of support for some time now. I made a lot with my last bull-run prediction. This time, not only is it the same pattern, but we've reached the end of the pennant; support is breaking through resistance and we're about to skyrocket to the moon. I do not say this lightly. Load up now or forever hold your peace.

OMG - Slow profits, good profits.OMG is one the top asset in the Crypto space. See below what we can expect!
Analysis:
The value is running at the support and could increase from here or head down. Confirmation is needed(we as Wise traders don't believe in catching the dip and sell the peak).
Indicators: RSI is trying to hold 50 level while 4 hrs TF showing strength. MACD is still bullish and seems to diverging to give bullish sign. Volume is low.
Further comments: Confirmation is needed and if support is broke then next potential supports has been marked in Graph.
Happy Trading!
