OmiseGo $OMG retraced to 0.5fib area from 9.9$ time for more.!For the last peak at 9.9$, I think the Wave3 doesn't finish yet.
From 9.9$, OMG retraced nicely to 0.5 fib area, time to go up more.
So it would be nice to continue Wave 3 along the orange line.
Next Target: 11 - 11.2
Stop Lost: 8.5
OMGUSD trade ideas
ID/NR7 trading with OMGUSDWe found ID/NR7 on daily chart and price hold above EMA20.
BUY @8.1
SL @7.4
TP @9.9
OMG Rocket Coming ? OMG after a big consolidation period in the Demand zone now moving on the upppside,,
And believe me this coin has potential of reaching $50 very easily
...
Market reversed from Demand zone ( which is 0.618 fib level)
breaking the Blue line confirms the BUllish cycle.. buy orders can be placed above $9
Target levels are above the all time High at Fib extension levels (1.27 and 1.41)
it can be more though,,,
MACD confirms the Bullish movement too...
This coin got some potential...so a long term holding isnt bad :)
Cheers
Happy trading
Crypto Outlook - OmiseGo - 2017-11-27It looks like strength has returned to the hibernating OmiseGo and that price is ready to ride the Bollinger Bands to the previous high!
OMISEGO LONG OPPORTUNITYGreat buying opportunity if price reaches the desired long target as specified within the chart. Keep in mind it's important for it to reach it before we will see more buyers! A break of trendline at 9.3333 and this pair will skyrocket upwards!
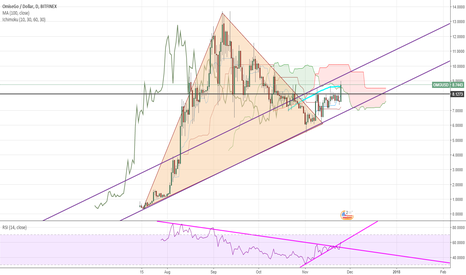
OmiseGo Plans To Rise After Trendline BreakoutOmiseGo showing some strength during the past week. It has managed to break above the downtrend trendline and on a corrective wave down it rejected it. Same happened with the RSI Oscillator breaking the trendline and then rejecting it.
Overall there are signs of emerging uptrend with the first target being near the previous resistance, the all-time high, which is at $13 area. It corresponds with the 327.2% Fibonacci retracement applied to the corrective wave after the trendline breakout.
Daily close below $6 support should invalidate bullish outlook and could extend the consolidation.
OMG Long Trade Current 6.85OMG just broke out of morning star reversal on the hourly which should take it out of double pattern. Almost 7.5:1
OMG Still looking good continuing its uptrend.Although the correlation is a bit loose, the pattern and price action of OMG seem to resemble an ascending triangle that was broken by the recent spike over about $8.00. The CEO of Omise and lead of OmiseGO will be holding an open house on November 30th where it is rumored the SDK may be released. If not then, significant developments are expected Q1 of 2018. What is also interesting is there is almost perfect symmetry on the way down, the pause at about $5.75, and then the subsequent rise we are currently experiencing. The remainder of the year should be interesting for longs. Next line in the sand is $9.00.
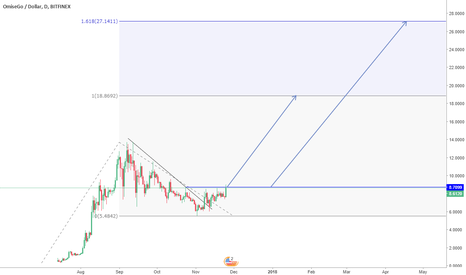
OMGUSD (1D): Uptrend possible. Targets 8 > 10 > 12 > 15 > 19 USDOMG is based on the "Be your own bank" approach. It is engineered to use eWallets. It is based on the Ethereum. It will activate its own blockchain in the fourth quarter of 2017. OMG is a decentralized payment network that combines Fiat and cryptos. User do not need a bank account to use OMG.
After a strong start, the consolidation could be completed and an entry interesting.
Targets: 8 > 10 > 12 > 15 > 19 USD
Let's see what happens. Happy trading. :-)
omgusdAs you can see the coin is coming out from a triangle of long period, rising price is expected with ambitious price. The movement is in the firt stage, you can buy with low risk.
OMGUSD - don't expect big things, yet.The downward pressure has pushed OMG to its 61.8% fibonacci level, creating a buy opportunity. Now we should see it rise to its 80%, 100% or 160%. However, an upward flag pattern appears, which could mean we have one more opportunity at the previous low, before bouncing upwards again. If the pattern breaks previous resistance, this creates new buying opportunity. Look for continuation of this pattern, in long run, which should include another downward spike - before breakout.
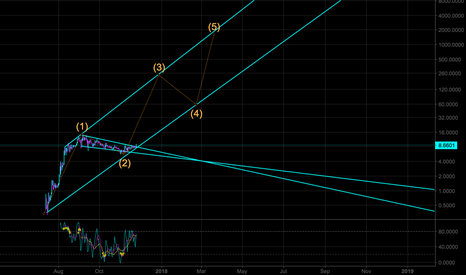
OMGUSD Long Term PersepectiveJust an idea to watch a potential channel for OMG. (Waves 3-5 are random estimates)
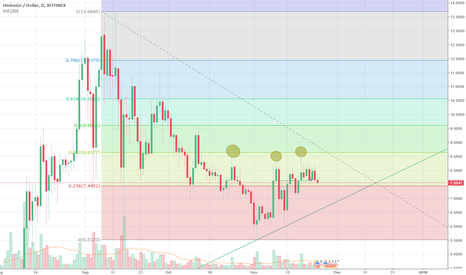
Fib on longer term scale and some resistance at ~$8.65 areaLooks like Fibonacci applied to the longer term chart shows this bull isn't quite done, especially if it can break through that $8.65 mark that has been hit almost 3 times. Mid-$9 by the end of the year likely and news of Q4 releases could push that even further up.
According to official communications from their team regarding their roadmap, perhaps some FOMO could get put into play here too over the next couple months.
twitter.com


