OM: The Future of RWA TokenizationBINANCE:OMUSDT is redefining Real-World Asset tokenization
- Real deals: SEED_TVCODER77_ETHBTCDATA:1B @DAMACOfficial + $500M MAG signed, not just promises
- 61% surge during market downturn, showing true strength
- Google Cloud + Binance backing proves institutional confidence
With BlackRock's Fink calling tokenization "the next evolution" and FWB:20B Trump-DAMAC partnership in play, @MANTRA_Chain is their blockchain.
Remember this post when BINANCE:OMUSDT hits $20.
OMUSDT trade ideas

OM: Smart Money AccumulatingI've been tracking BINANCE:OMUSDT price action closely.
Daily showing a perfect horizontal channel - heavy accumulation phase.
Plus, massive bullish divergence, stronger than $ETH.
The setup is absolutely perfect:
Trump: "America the world capital of crypto"
Fink: BlackRock wants tokenized securities
DAMAC: FWB:20B US expansion plans + SEED_TVCODER77_ETHBTCDATA:1B tokenization deal with @MANTRA_Chain
What caught my attention? 3 whales pulled $19.85M from Binance in 24h.
Smart money positioning at channel support.
BINANCE:OMUSDT = $10 soon.

OM x DAMAC: $1B Real Estate Tokenization BeginsDubai Real Estate Giant DAMAC Partners with @MANTRA_Chain!
BINANCE:OMUSDT is leading the charge with a SEED_TVCODER77_ETHBTCDATA:1B tokenization deal, bringing @DAMACOfficial real estate portfolio on-chain.
Tokenizing luxury real estate, hospitality & data centers

$10+ IncomingWhen the market was bleeding, BINANCE:OMUSDT hit a new ATH with +60%
The SEED_TVCODER77_ETHBTCDATA:1B DAMAC tokenization deal + their FWB:20B US expansion plans = MASSIVE for @MANTRA_Chain
The only L1 crushing it in RWA tokenization space with real institutional backing.
Clear path to $10+ with this momentum. My highest conviction play

OM USDTNASDAQ:OM If you missed 💰 #OM, then this is the perfect time to load up! 💁♂️
📈 Ascending triangle breakout forming
🔥 Strong consolidation – ready for the next rally
🚀 Targets: $6.77, $7.75, and $8.82

OMThis project kinda scares me, 1.8B of tokens, whatever happens around this is steady and rising in its own power, a security L1 blockchain.
i have more than 1 month that i am going around to understand how this thing works, and dont know how to explain it, i am just trying to think, what it would be its price on the top of bull market, or in 5 years, if it will be alive.
it looks like it will go long.
nfa
dyor
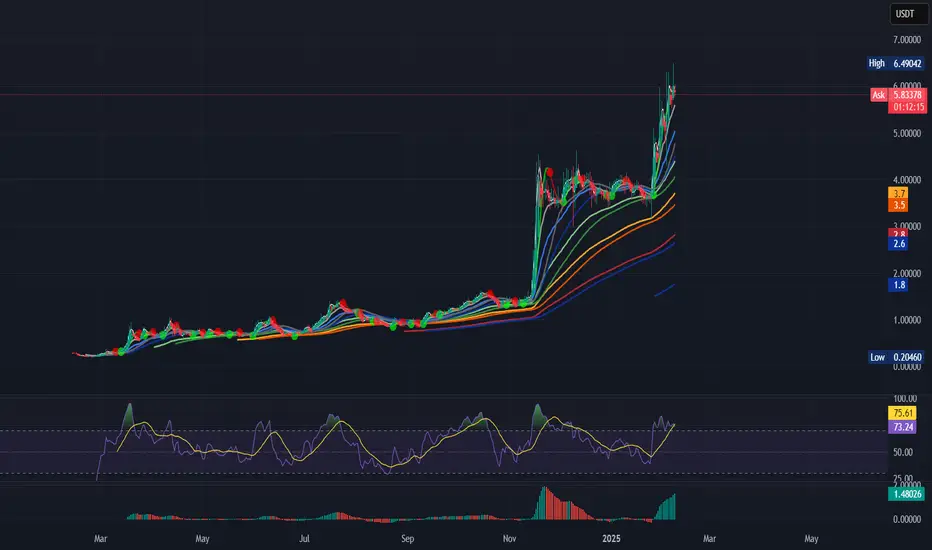
The key is whether the price can be maintained above 5.7948
Hello, traders.
If you "Follow", you can always get new information quickly.
Please click "Boost" as well.
Have a nice day today.
-------------------------------------
(OMUSDT 1M chart)
The chart was broken by a sharp rise.
The point to watch is whether the BW(100) indicator or HA-High indicator is formed on the 1M chart.
-
(1D chart)
It formed an important support and resistance zone by moving sideways in the Fibonacci ratio range of 0(3.1730) ~ 0.382(4.4436).
Therefore, if it falls below this range, I think it would be better to stop trading and wait and see.
-
The high boundary zone is formed in the 4.8752-5.3288 range.
Accordingly, if it falls without support near 5.7948, the key is whether it will be supported near 4.8752-5.3288.
-
The strong support zone is near 3.7312.
-
Thank you for reading to the end.
I hope you have a successful trade.
--------------------------------------------------
- Big picture
I used TradingView's INDEX chart to check the entire range of BTC.
(BTCUSD 12M chart)
Looking at the big picture, it seems to have been maintaining an upward trend following a pattern since 2015.
That is, it is a pattern that maintains a 3-year uptrend and faces a 1-year downtrend.
Accordingly, the uptrend is expected to continue until 2025.
-
(LOG chart)
As you can see from the LOG chart, the uptrend is decreasing.
Accordingly, the 46K-48K range is expected to be a very important support and resistance range from a long-term perspective.
Therefore, we expect that we will not see prices below 44K-48K in the future.
-
The Fibonacci ratio on the left is the Fibonacci ratio of the uptrend that started in 2015.
In other words, it is the Fibonacci ratio of the first wave of the uptrend.
The Fibonacci ratio on the right is the Fibonacci ratio of the uptrend that started in 2019.
Therefore, this Fibonacci ratio is expected to be used until 2026.
-
No matter what anyone says, the chart has already been created and is already moving.
How to view and respond to this is up to you.
When the ATH is updated, there are no support and resistance points, so the Fibonacci ratio can be used appropriately.
However, although the Fibonacci ratio is useful for chart analysis, it is ambiguous when used as support and resistance.
This is because the user must directly select the important selection points required to create Fibonacci.
Therefore, since it is expressed differently depending on how the user specifies the selection points, it can be useful for chart analysis, but it can be seen as ambiguous when used for trading strategies.
1st : 44234.54
2nd : 61383.23
3rd : 89126.41
101875.70-106275.10 (Overshooting)
4th : 134018.28
151166.97-157451.83 (Overshooting)
5th : 178910.15
-----------------

OM x DAMAC: RWA RevolutionBINANCE:OMUSDT just hit a major milestone.
SEED_TVCODER77_ETHBTCDATA:1B in assets from @DAMACOfficial, one of Dubai's biggest real estate giants, are being tokenized on @MANTRA_Chain.
This is a game-changer for the RWA space—bridging real estate, blockchain, and global investors.
#MANTRA is leading the future of asset tokenization. The FWB:16T #RWA market is calling.
#Blockchain #Crypto #RWAs

OM: The #1 RWA Blockchain—Top 10 InevitableThe market has been slow, but smart investors see this as an opportunity. Some of the strongest projects are at a discount, and BINANCE:OMUSDT is one of them.
MANTRA is positioned for massive upside:
The #1 RWA blockchain – First regulated Layer-1 for tokenized real-world assets
Backed by institutions – Partnerships with #GoogleCloud, #DAMAC, #BlackRock (via Libre), Novus Aviation, and more
Trillion dollars RWA market – Institutions are moving in, and @MANTRA_Chain is leading the charge
SEED_TVCODER77_ETHBTCDATA:5B + market cap & growing – Still early in the RWA wave
It’s rare to see a project with this much real-world adoption & institutional backing at this stage.
Top 10 isn't just possible. It's inevitable!

OM: The #1 RWA Blockchain—Top 10 InevitableThe market has been slow, but smart investors see this as an opportunity. Some of the strongest projects are at a discount, and NASDAQ:OM is one of them.
MANTRA is positioned for massive upside:
The #1 RWA blockchain – First regulated Layer-1 for tokenized real-world assets
Backed by institutions – Partnerships with #GoogleCloud, #DAMAC, #BlackRock (via Libre), Novus Aviation, and more
Trillion dollars RWA market – Institutions are moving in, and @MANTRA_Chain is leading the charge
SEED_TVCODER77_ETHBTCDATA:5B + market cap & growing – Still early in the RWA wave
It’s rare to see a project with this much real-world adoption & institutional backing at this stage.
Top 10 isn't just possible. It's inevitable!

$6.8 Target IncomingBINANCE:OMUSDT one of the strongest projects in the RWA category.
Strong support level around 4.2$ is indicating a potential bounce, I just aped in $75k worth spot position for a target of $6.8.
OM x DAMAC: $1B RWA DealNASDAQ:OM just unlocked a whole new level.
DAMAC—Dubai's real estate powerhouse—is bringing SEED_TVCODER77_ETHBTCDATA:1B of assets to @MANTRA_Chain’s blockchain.
This deal is just the start. The real-world asset market is HUGE, and NASDAQ:OM is in the driver’s seat.
#RWA #MANTRA #Layer1

OM’s Path to Top 10Historical Trends: A Bullish Q1 for RWA Projects and BINANCE:OMUSDT ?
As we enter 2025's first quarter,I'm noticing a significant shift in the crypto narrative. While previous Q1s were about DeFi and L2s, this year's focus is crystal clear: RWA Tokenization.
Why?
The signs are unmistakable:
@BlackRock's Larry Fink pushing for SEC approval on tokenization
@DAMACOfficial's SEED_TVCODER77_ETHBTCDATA:1B tokenization deal with @MANTRA_Chain
Major institutions entering the RWA space
But what's truly fascinating is MANTRA's position in all this. As the first regulated L1 specifically built for RWA tokenization, BINANCE:OMUSDT is perfectly positioned to capture this momentum.
So,will Q1 2025 be the quarter where #RWA projects dominate? I'm confident it will be. With #MANTRA's SEED_TVCODER77_ETHBTCDATA:1B DAMAC deal is just the beginning, the stage is set for BINANCE:OMUSDT to reach top 10 where it belongs.
The smart money isn't waiting. They're positioning early.

OMUSDT LONG Crypto Introduction
MANTRA Chain is a Cosmos SDK-based L1 blockchain addressing regulatory compliance gaps in the Cosmos ecosystem. Positioned as the "blockchain for tokenized RWAs and regulated digital assets," MANTRA offers high-performance, scalable blockchain architecture, supporting both permissionless and regulated, compliant applications.

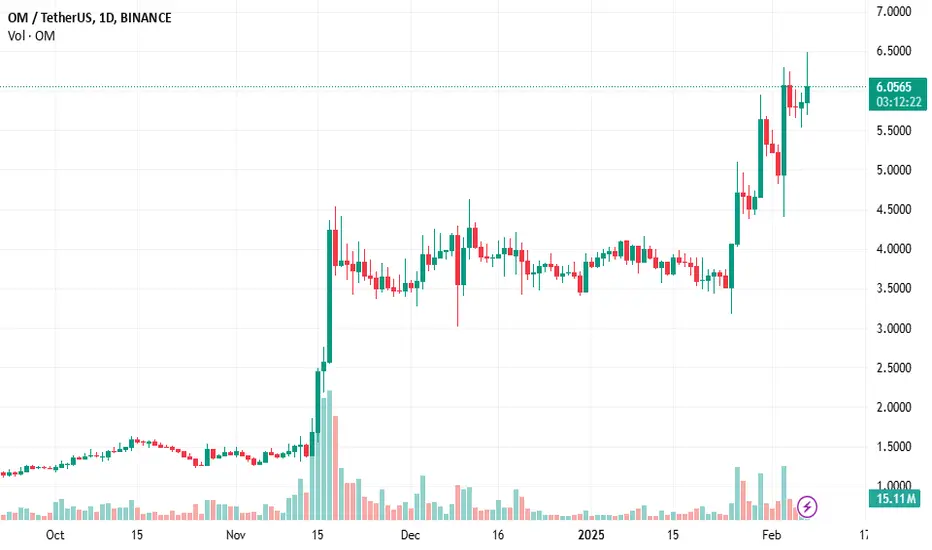
OMUSDT → Consolidation in a triangle before the rallyBINANCE:OMUSDT is a paranormal coin in this case, as it is one of the few projects that shows bullish dynamics while all altcoins are finding bottom after bottom.
Perhaps the situation partly depends on BINANCE:BTCUSD . If it starts to fall even deeper, nothing and no one will help here. But locally bitcoin is forming a resistance breakout and if the bulls hold this trend, the BINANCE:OMUSDT.P coin may have a bullish driver that can support the bullish movement.
At the moment, the focus is on the triangle (wedge) resistance and the base of the 5.6756 pattern. Two bullish scenarios should be considered: Growth after a resistance breakout or growth after a false breakdown of support.
Resistance levels: 5.9821, 6.30
Support levels: 5.75, 5.6756
At the moment, a consolidation within the triangle boundaries is being formed. But when the resistance is broken, the market may move to the realization phase and the impulse may be quite sharp. Ahead, beyond 6.3, there is no resistance...
Regards R. Linda!


OM: the most resilient crypto asset todayI'm setting up a buy trigger for OM. Among the crypto assets I track, this one has shown remarkable resilience. During today's market drop, most assets pulled back to the 200-period moving average, with even major market cap leaders like ETH and BNB breaking well below this key support level intraday. In contrast, OM remained strong, with its deepest decline barely dipping below the 20-period moving average.
Today's sharp market recovery indicates strong buying interest at lower prices, which is an undeniably bullish signal. However, given the market's recent streak of failed breakout attempts, I plan to approach this setup with caution.
I'm taking a modest position in OM if the trigger is activated. Due to the relatively wide stop-loss (-32%), I will allocate only 3% of my portfolio, limiting potential downside risk to -1%. On the upside, if the trade performs well, the projected return is 160%, translating to a +4,8% portfolio gain.

$10 LoadingCRYPTOCAP:SUI market cap GPW:11B +
BINANCE:OMUSDT market cap SEED_TVCODER77_ETHBTCDATA:5B +
Meanwhile BINANCE:OMUSDT is the real RWA chain with billion-dollar tokenization deals already signed.
BINANCE:OMUSDT → $10 loading…

OM: The Future of RWA Tokenization in 2025RWA tokenization is primed to dominate in 2025.
Just look at the top 10 coins, not a single RWA-focused chain.
BlackRock's Fink calls tokenization "the next evolution" + SEED_TVCODER77_ETHBTCDATA:1B @DAMACOfficial - @MANTRA_Chain deal live
BINANCE:OMUSDT will be the obvious winner.

OM: Bringing Trillion-Dollar Markets OnchainI just came across the $200B+ aviation market entering blockchain via BINANCE:OMUSDT Novus Aviation partnership, and I'm honestly amazed.
This comes right after @MANTRA_Chain's SEED_TVCODER77_ETHBTCDATA:1B @DAMACOfficial deal for real estate tokenization.
While traditionalists might be skeptical, the implications are undeniable - we're seeing real-world trillion-dollar markets starting to move onchain, and this could pave the way for institutional adoption.
Regulated. Institutional. Unstoppable. $OMUSDT.

$12 Target LockedBINANCE:OMUSDT MELTING FACES. I SAID DON'T FADE IT.
The chart is looking so strong
~ My Target is $12 —LFG

OM: Leading the RWA RevolutionBINANCE:OMUSDT is leading the regulated RWA tokenization wave, connecting TradFi with blockchain through real, signed deals.
With SEED_TVCODER77_ETHBTCDATA:1B @DAMACOfficial partnership (connected to FWB:20B #Trump data centers) + Novus Aviation opening up $200B+ market, @MANTRA_Chain is where institutional adoption is actually happening.
While others talk about #RWA potential, #MANTRA is delivering it. @BlackRock's Fink is right - tokenization is next. Wall Street is watching. BINANCE:OMUSDT is moving.
