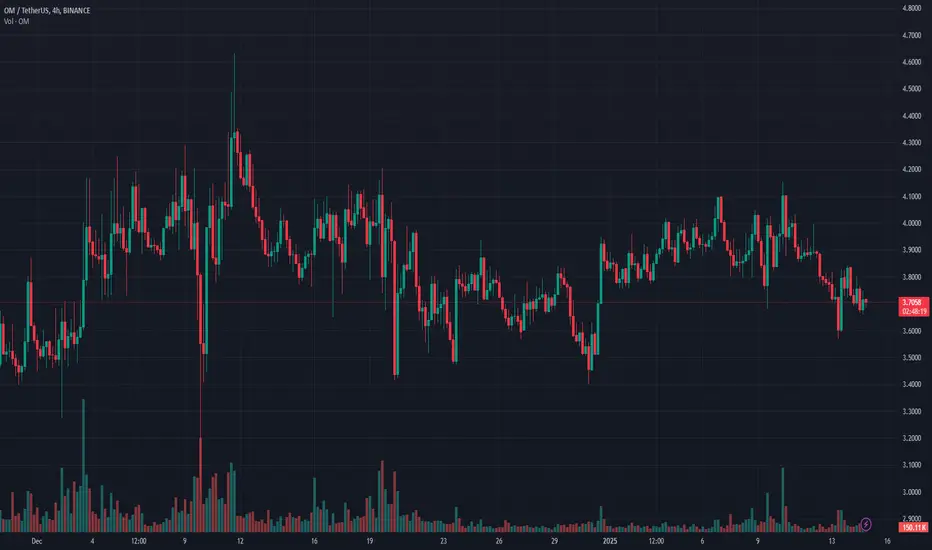
The $OM Power Play: Faded at $1B, $3B, and Now? $20B Awaits!
You faded NASDAQ:OM at SEED_TVCODER77_ETHBTCDATA:1B , then at SEED_TVCODER77_ETHBTCDATA:3B —are you seriously gonna fade it at SEED_TVCODER77_ETHBTCDATA:10B next?
RWAs, DAMAC, AI—all aligning perfectly.
Keep fading, champ. NASDAQ:OM to FWB:20B ?
OMUSDT trade ideas
OM/USDTKey Level Zone : 4.020 - 4.050
HMT v4.1 detected. The setup looks promising, supported by a previous upward/downward trend with increasing volume and momentum, presenting an excellent reward-to-risk opportunity.
HMT (High Momentum Trending):
HMT is based on trend, momentum, volume, and market structure across multiple timeframes. It highlights setups with strong potential for upward movement and higher rewards.
Whenever I spot a signal for my own trading, I’ll share it. Please note that conducting a comprehensive analysis on a single timeframe chart can be quite challenging and sometimes confusing. I appreciate your understanding of the effort involved.
Important Note :
Role of Key Levels:
- These zones are critical for analyzing price trends. If the key level zone holds, the price may continue trending in the expected direction. However, momentum may increase or decrease based on subsequent patterns.
- Breakouts: If the key level zone breaks, it signals a stop-out. For reversal traders, this presents an opportunity to consider switching direction, as the price often retests these zones, which may act as strong support-turned-resistance (or vice versa).
My Trading Rules
Risk Management
- Maximum risk per trade: 2.5%.
- Leverage: 5x.
Exit Strategy
Profit-Taking:
- Sell at least 70% on the 3rd wave up (LTF Wave 5).
- Typically, sell 50% during a high-volume spike.
- Adjust stop-loss to breakeven once the trade achieves a 1.5:1 reward-to-risk ratio.
- If the market shows signs of losing momentum or divergence, ill will exit at breakeven.
The market is highly dynamic and constantly changing. HMT signals and target profit (TP) levels are based on the current price and movement, but market conditions can shift instantly, so it is crucial to remain adaptable and follow the market's movement.
If you find this signal/analysis meaningful, kindly like and share it.
Thank you for your support~
Sharing this with love!
HMT v2.0:
- Major update to the Momentum indicator
- Reduced false signals from inaccurate momentum detection
- New screener with improved accuracy and fewer signals
HMT v3.0:
- Added liquidity factor to enhance trend continuation
- Improved potential for momentum-based plays
- Increased winning probability by reducing entries during peaks
HMT v3.1:
- Enhanced entry confirmation for improved reward-to-risk ratios
HMT v4.0:
- Incorporated buying and selling pressure in lower timeframes to enhance the probability of trending moves while optimizing entry timing and scaling
HMT v4.1:
- Enhanced take-profit (TP) target by incorporating market structure analysis
Why OM Could Decline to $2 in the Short TermThe recent surge in OM token's price has been impressive, but market dynamics suggest potential risks of a short-term correction. Several factors could contribute to a decline in the price, possibly reaching the $2 level:
1. Overvaluation and Profit-Taking
The OM token has experienced a rapid and substantial price increase in a relatively short period. Such exponential growth often leads to overvaluation, where the market price outpaces the token's intrinsic value or utility.
Early investors and traders may begin to take profits, especially after significant gains, creating selling pressure that could drive the price downward.
2. Market Sentiment and Speculation
A large portion of OM's recent price movement may be driven by speculative trading rather than fundamental developments. If market sentiment shifts or a negative event occurs, speculative traders could exit their positions en masse.
A decline in trading volume or a reduction in bullish sentiment could exacerbate this effect.
3. Potential Lack of Immediate Utility
While OM is positioned as a significant player in the DeFi and RWA (Real World Asset) tokenization space, its current utility and adoption might not yet fully justify its market cap.
Investors might reassess the token's value relative to its actual use cases and market penetration, leading to a price adjustment.
4. Trend in Bitcoin (BTC)
Bitcoin, as the leading cryptocurrency, often sets the tone for the broader market. Currently, BTC is experiencing a downward trend, with selling pressure and weaker buying interest dominating the market.
A falling BTC price historically triggers corrections in altcoins, as investor confidence wavers and capital flows out of higher-risk assets like OM.
If BTC continues its bearish trend, it could significantly impact OM, amplifying existing selling pressure and pulling its price lower toward $2.
5. Broader Market Trends
Cryptocurrencies are highly correlated with broader market trends. In addition to BTC’s downtrend, other macroeconomic factors such as interest rate hikes, regulatory developments, or reduced liquidity in risk assets could further weaken the cryptocurrency market.
Combined with OM’s recent price surge, these conditions make the token more vulnerable to corrections.
6. Technical Indicators Suggest Overbought Conditions
Technical analysis tools such as the Relative Strength Index (RSI) may indicate that OM is currently in overbought territory. Historically, such conditions are followed by price corrections.
Support levels near $2 could become the next logical target if resistance levels above the current price fail to hold.
7. Increased Competition
The DeFi space and RWA tokenization market are becoming increasingly competitive, with several projects vying for dominance. New partnerships, technological advancements, or announcements by competitors could divert attention and investment away from OM.
Conclusion
While OM has shown strong potential as a DeFi and RWA tokenization platform, the combination of overvaluation, speculative trading, BTC’s ongoing downtrend, technical indicators, and external market factors creates a compelling case for a potential short-term price correction. A decline to $2 would represent a natural retracement, providing an opportunity for the token to establish a more sustainable base for future growth. Investors should approach with caution and consider both the risks and opportunities in their investment strategies.
MANTRA and DAMAC to Tokenize $1 Billion in Real-World AssetsIn a groundbreaking collaboration, blockchain company MANTRA has partnered with UAE-based property conglomerate DAMAC to tokenize over $1 billion worth of real-world assets (RWA). This ambitious initiative highlights the growing trend of blockchain adoption for streamlining traditional investment processes and enhancing accessibility for investors globally.
Partnership Insights
MANTRA, a layer-1 blockchain designed specifically for tokenized real-world assets, is set to transform DAMAC’s extensive portfolio, which spans real estate development, hospitality, and data centers. By leveraging blockchain technology, this partnership aims to:
- Streamline Investments: Tokenization simplifies traditional investment mechanisms, offering faster settlements and broader accessibility.
- Enhance Transparency: Investors gain access to a secure and transparent method of participating in diverse financial opportunities.
- Expand Market Accessibility: Both retail and institutional investors can explore DAMAC’s portfolio with unprecedented ease.
The specifics of which DAMAC properties will be tokenized are expected to be disclosed in the coming weeks, with offerings slated to begin in early 2025. This marks a pivotal step in integrating blockchain technology into mainstream industries, aligning with DAMAC’s history of embracing innovation—from accepting cryptocurrency payments in Bitcoin (BTC) and Ethereum (ETH) to planning a $20 billion investment in U.S. data centers.
Tokenization’s potential is immense, with industry projections estimating the RWA market could grow to trillions of dollars by the end of this decade. Reports from McKinsey, BCG, 21Shares, and Bernstein underscore the transformative potential of this technology, with significant efficiency gains and expanded investment opportunities.
MANTRA’s Strategic Growth
MANTRA’s focus on the Middle East region underscores its commitment to revolutionizing traditional financial systems. Earlier this year, it announced plans to tokenize $500 million worth of assets for Dubai-based real estate developer MAG Group. The network’s mainnet launch in October and subsequent native token ( NASDAQ:OM ) growth further solidify its position as a leader in blockchain innovation.
NASDAQ:OM has experienced a remarkable 200% market capitalization growth over the past three months, now standing at $3.6 billion according to CoinGecko. This growth reflects increasing investor confidence in MANTRA’s capabilities and vision.
Technical Analysis of NASDAQ:OM
As of this writing, NASDAQ:OM is trading at a slight decline of 1.34%, forming a symmetrical triangle pattern. This technical setup is often indicative of a potential breakout in either direction:
- Bullish Scenario: A breakout above the upper trendline could trigger a significant rally, pushing NASDAQ:OM to new highs.
- Bearish Scenario: Conversely, a breakdown below the lower trendline could lead to a selling spree, with prices potentially retesting lower support levels.
The confined trading range highlights the importance of closely monitoring price movements for any decisive action. Traders should look for increased volume and momentum as potential confirmation signals for a breakout or breakdown.
Broader Implications
This partnership between MANTRA and DAMAC is more than just a business deal; it is a testament to the growing adoption of blockchain in traditional industries. By tokenizing real-world assets, the collaboration aims to:
- Democratize investment opportunities for a global audience.
- Enhance operational efficiencies across industries.
- Cement the UAE’s position as a leader in blockchain and crypto innovation.
Conclusion
The MANTRA-DAMAC collaboration represents a bold step forward in the tokenization of real-world assets. With a solid foundation in both technical and fundamental aspects, NASDAQ:OM is poised for substantial growth, making it a token to watch in the coming months. As the blockchain ecosystem continues to mature, this partnership could set the stage for broader adoption of tokenized investments worldwide.
DAMAC x MANTRA: Redefining Real Estate & BlockchainWatching a fascinating shift in real estate & data.
DAMAC's latest moves tell a bigger story - they're bridging 3 massive industries: Middle East real estate, US data centers and blockchain infrastructure.
They partnered with #MANTRA as their tech backbone for the SEED_TVCODER77_ETHBTCDATA:1B initial tokenization. Not CRYPTOCAP:ETH , not CRYPTOCAP:SOL - but NASDAQ:OM , specialized RWA L1.
Same week they're planning #US data centers with Trump, they're also moving assets onchain. This isn't just another 'partnership' - it's a blueprint for how traditional businesses will operate in 2025+.
Loading up my NASDAQ:OM bags here.
NFA. DYOR. Just my 2 cents.
DAMAC x MANTRA: Blockchain Adoption BeginsTrump just signed a FWB:20B deal with DAMAC for U.S. data centers.
Now DAMAC is tokenizing SEED_TVCODER77_ETHBTCDATA:1B of its assets—real estate, hospitality, even those data centers—on MANTRA Chain.
This isn’t hype. It’s real-world adoption of blockchain tech by major players. Hussain Sajwani clearly sees the value of tokenization, and MANTRA’s infrastructure is built for this.
Blockchain is moving beyond buzzwords—this is what mass adoption starts to look like. Keep an eye on $OM.
#Crypto #RWAs #Blockchain
DAMAC x MANTRA: Transforming RWA AdoptionDAMAC's moves are fascinating to watch:
Just signed a FWB:20B data center deal with Trump, and now announcing a SEED_TVCODER77_ETHBTCDATA:1B tokenization partnership with MANTRA Chain. What's interesting is they're not just tokenizing real estate - they're including hospitality assets and potentially data centers.
NASDAQ:OM sitting at <$5 while handling this scale of institutional adoption is quite something. First fully compliant RWA L1 blockchain, Google Cloud as validator, and now #DAMAC chose them exclusively for their digital asset future.
Middle East money flowing into US tech infrastructure, and they picked #MANTRA as their blockchain foundation. The implications here are massive for #RWA adoption.
Watching NASDAQ:OM closely. This feels like early CRYPTOCAP:ETH enterprise adoption days. These are the deals that transform projects.
NAFA.DYOR
Trump x DAMAC x MANTRA: RWA Revolution Trump x DAMAC x MANTRA – This could reshape crypto and RWAs as we know it.
1️⃣ Trump secures a FWB:20B deal with DAMAC:
Hussain Sajwani’s DAMAC Group is teaming up with Trump to build FWB:20B in data centers across the U.S. This move is a massive step for global tech infrastructure and digital transformation.
2️⃣ DAMAC partners with MANTRA to tokenize SEED_TVCODER77_ETHBTCDATA:1B in assets:
In a separate but equally monumental deal, DAMAC is working with MANTRA to tokenize SEED_TVCODER77_ETHBTCDATA:1B in assets, including real estate, hospitality and data centers. The tokenized assets will launch exclusively on MANTRA Chain in early 2025.
This is a textbook example of mass adoption in the making:
👉 DAMAC’s Trump-backed FWB:20B data centers signal its commitment to innovation.
👉 Choosing MANTRA to tokenize assets puts NASDAQ:OM at the center of the RWA narrative.
👉 With the first-mover advantage in regulated tokenization, #MANTRA is now the Ethereum of #RWAs—but compliant.
With institutions like #DAMAC diving into blockchain, NASDAQ:OM is primed for a breakout.
#CryptoNews #Blockchain
$OM: At the Heart of Mega-DealsCONNECTING THE DOTS 🔗
Yesterday: DAMAC + Trump announced FWB:20B US data center deal
Today: DAMAC picks MANTRA for SEED_TVCODER77_ETHBTCDATA:1B asset tokenization
#MANTRA is positioning itself at the intersection of mega-deals. This isn't just about real estate anymore.
SEED_TVCODER77_ETHBTCDATA:1B today, what's next?
NASDAQ:OM chart looking ready 📈
#RWA #Blockchain #Trump #DAMAC
Pioneering a $1B Tokenization Revolution in Real Estate
MANTRA x DAMAC Group in a $1 BILLION deal to tokenize real estate, hospitality & more in the Middle East!
Assets go live in 2025 exclusively on @MANTRA_Chain.
This is mass adoption in the making—bringing real-world assets onchain.
Institutional + retail demand skyrocketing.
NASDAQ:OM to $10+ is not a dream—it's coded.
#MANTRA #RWA #Crypto
OM Building Momentum: Symmetrical Triangle Breakout Ahead?
#OM is consolidating within a symmetrical triangle on the 4-day chart 💁♂️
The pattern suggests momentum is building for a potential bounce from the ascending support 🤔
If successful, price could rise towards targets at $5.00, $5.68, and $6.44 🎯
$OM: Bridging Real Assets & Digital ValueNASDAQ:OM is positioning itself for massive growth by tapping into one of the most lucrative markets—RWA tokenization.
Think about it👇
✅ Direct revenue from real estate tokenization fees
✅ Aviation deal flows
✅ Strategic banking integration with Zand Bank
✅ Institutional-grade infrastructure, providing regulatory compliance for real-world assets
✅ Unlocking liquidity in private equity, green energy, and real estate
#MANTRA is creating a perpetual value stream, turning physical assets into digital investments that generate real-world impact. Every tokenized property, every green energy project, and every real estate deal now feeds back into the ecosystem.
NASDAQ:OM quietly making both institutions and retail investors more profitable.
Been saying this: Infra > Hype
This cycle belongs to protocols that capture real-world value.
#NFA
$OM: Building Strength at Key SupportNASDAQ:OM continues to lead the charge in the RWA tokenization sector, combining institutional backing with compelling market dynamics.
Here’s why I’m looking to build my position as we approach a key support zone.
Technical Setup:
🔹 Watching for confirmation near $3.8—a historically strong support zone for reversals.
🔹 Potential bull flag setup forming, adding bullish confluence.
🔹 ATH at $4.60; breakout above could set the stage for new highs.
🔹 Bullish divergence is visible, signaling momentum could shift back in favor of buyers soon.
Plan:
🔹 Building position around the $3.80 support zone for optimal risk/reward.
🔹 Waiting for confirmation signals like a bounce from support or reversal candles before increasing exposure.
In bull markets, leaders tend to keep leading, and #MANTRA has the fundamentals, narrative, and technical structure to remain a standout performer in 2025
MANTRA: Leading the RWA RevolutionMANTRA is positioning itself as a leader in RWA tokenization, setting new standards for regulated L1s in 2024.
Quick reality check:
☑️First regulated L1 for RWAs
☑️15,230% YoY growth
☑️10,000 TPS capability
☑️Upto 18% staking APY
☑️$500M+ in tokenization deals live
First mover advantage in regulated tokenization infrastructure is hard to beat.
This kind of momentum sets the stage for even bigger moves in 2025 – in bull markets, winners keep winning.
$OM: The Next Big Thing in RWAsJust noticed something interesting with $OM...
Been watching how #MANTRA is building: first regulated L1 focusing purely on real-world assets. The Dubai ecosystem they're creating with the MAG & Novus is impressive.
Market's telling a clear story:
- Shorts getting absolutely rekt ($20M+ liquidated)
- Meanwhile, only ~$400K in long liquidations
- Most holders staking at 18% APY
- Real institutional players involved
Reminds me of early CRYPTOCAP:SOL days, but with actual use cases already live.
#CryptoNews #MarketTrends #Binance #Crypto
$OM: Diamond Hands Fueling the RallyYou need to look at NASDAQ:OM right now.
The only holders left are diamond hands who’ve been accumulating for months. With $23M+ in short liquidations and no sell pressure, NASDAQ:OM is ready to rally.
Unlike hype-driven projects, #MANTRA is building the only regulated L1 for tokenizing real-world assets (#RWAs).
With strong fundamentals and growing institutional interest, $10 is within reach.
(Not financial advice—just observations.
TradeCityPro | OM: Upward Momentum and Airdrop Anticipation👋 Welcome to TradeCityPro!
In this analysis, I will examine the OM coin, which is associated with the MANTRA network. This coin is about to start its airdrop rounds in a few days.
📅 Daily Timeframe: High Upward Momentum and Readiness for the Next Leg In the daily timeframe, we are observing a very strong and powerful upward trend. Over the past year, this coin has grown more than 5000% and has garnered significant attention from the crypto community and enthusiasts.
🔍 Currently, a curved upward trend line has emerged in the latest cycle, starting after the price bottomed out at $0.6352 and corrected to $1.6071 before starting a new upward move reaching $4.2374.
✨ The price has touched this upward trend line several times and now, having reached the resistance at $4.2374, has formed a ranging box between this resistance and $3.4144, potentially undergoing reaccumulation. Breaking above $4.2374 could significantly impact the further price increase of this coin.
🚀 If the ceiling breaks, the next price targets based on Fibonacci would be around $10 and $20, technically feasible as the price has not corrected significantly and has maintained market momentum. However, reaching a $20 target would require OM to enter the top 10 market cap, surpassing cryptocurrencies like AVAX, SUI, and TON, which is a challenging task.
🧩 The RSI oscillator is ranging between 40.35 to 59.93, and breaking either of these areas will significantly impact the market trend. A break below 40.35 could increase the likelihood of a correction down to the $2 area, around the 0.5 and 0.618 Fibonacci levels. Breaking above 59.93 would increase the likelihood of surpassing $4.2374.
⏳ 4-Hour Timeframe: Futures Triggers In this timeframe, we see a long-term 47-day box, which is very clean and has well-defined ceilings and floors between $3.4144 and $4.3140. Breaking either of these areas would provide a good position.
📉 For a short position, breaking $3.1440 is suitable with the next supports at $2.5442 and $2.2264, near the 0.5 and 0.618 Fibonacci levels of the daily timeframe.
📈 For a long position, breaking $4.3140 is the only long trigger for now, and no target can be set for this movement until a new structure is formed.
🔑 The market volume is nearing its lowest point, increasing the likelihood of breaking one of these areas each day.
📝 Final Thoughts
This analysis reflects our opinions and is not financial advice.
Share your thoughts in the comments, and don’t forget to share this analysis with your friends! ❤️