Whale Alert: Justin Sun Dives into $OM!Another power play in the books!
justinsuntron has stepped into BINANCE:OMUSDT for the first time, securing a significant amount from #Poloniex’s multisig.
Whales are moving. Are you?
OMUSDT trade ideas

Big Money Moves: Justin Sun Enters $OM—Are You Watching?The blueprint is clear. Follow the money.
justinsuntron just entered BINANCE:OMUSDT for the first time—a major accumulation from #Poloniex’s multisig.
If you’re not paying attention, you’re already late

Elite Entry: Justin Sun Makes His First $OM Move!The BINANCE:OMUSDT club just got an elite new member.
justinsuntron has officially accumulated for the first time—and it’s a BIG move.
This is the kind of momentum you don’t ignore.

Justin Sun's First $OM Buy,Big Moves Ahead! Money talks, and @justinsuntron just spoke LOUD.
A fresh BINANCE:OMUSDT accumulation straight from #Poloniex’s multisig—his first-ever buy!
What’s next? The market is watching.

Justin Sun Joins $OM—Are You In? The power play begins!
@justinsuntron has officially accumulated his first BINANCE:OMUSDT bag from #Poloniex’s multisig.
The question is: Are you ahead of the curve, or behind it? 🚀

Justin Sun Joins $OM! When whales enter, the tides shift!
@justinsuntron’s first-ever BINANCE:OMUSDT buy is locked in.
With a move this size, the next wave might not wait for you.
Whale Alert: Justin Sun Accumulates $OM! Big money moves in silence… until it doesn’t.
@justinsuntron just secured a serious amount of BINANCE:OMUSDT straight from #Poloniex’s multisig.
If you weren’t watching before, now’s the time.
Major Buy Alert: Justin Sun Joins $OM! BINANCE:OMUSDT just got a MAJOR vote of confidence!
@justinsuntron has officially entered the game with a massive accumulation. Funds received from #Poloniex’s multisig!
Could this be the start of something huge? 🚀

Whale Alert , TRX Leader Accumulates $OM! Follow the whales, not the crowd!
The CRYPTOCAP:TRX leader just added a serious bag of BINANCE:OMUSDT to his holdings. First-ever accumulation confirmed!
This isn’t just noise—this is a statement.

Justin Sun Secures $1.72M $OM Big Moves Ahead!When @justinsuntron makes a move, the market follows.
His latest? $1.72M worth of BINANCE:OMUSDT secured from #Poloniex’s multisig.
Pay attention. 🚀

Justin Sun Backs $OM, Smart Money Moves In! Smart money knows where to go!
@justinsuntron has just entered BINANCE:OMUSDT with a massive accumulation. Funds sourced directly from #Poloniex’s multisig!
The signal is clear. The next big thing is here!

Justin Sun Joins $OM—Big Money Moves! The #RWA King makes his move! 👑
@justinsuntron just accumulated 250K $NASDAQ:OMUSDT ($1.72M) from #Poloniex’s multisig.
This marks his first-ever $NASDAQ:OMUSDT purchase! 🚀
Big players are watching. Are you? 👀

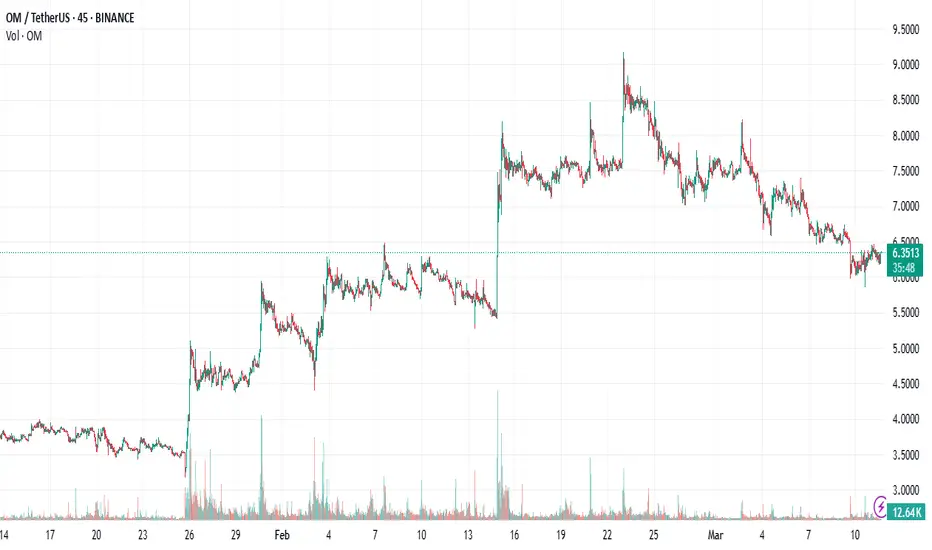
OMUSDT UPDATEOMUSDT is a cryptocurrency trading at $6.2800. Its target price is $8.0000, indicating a potential 25%+ gain. The pattern is a Bullish Falling Wedge, a reversal pattern signaling a trend change. This pattern suggests the downward trend may be ending. A breakout from the wedge could lead to a strong upward move. The Bullish Falling Wedge is a positive signal, indicating a potential price surge. Investors are optimistic about OMUSDT's future performance. The current price may be a buying opportunity. Reaching the target price would result in significant returns. OMUSDT is poised for a potential breakout and substantial gains.

#OM/USDT#OM
The price is moving in a descending channel on the 1-hour frame and is adhering to it well and is heading to break it strongly upwards and retest it
We have a bounce from the lower limit of the descending channel, this support is at a price of 5.92
We have a downtrend on the RSI indicator that is about to break and retest, which supports the rise
We have a trend to stabilize above the Moving Average 100
Entry price 6.27
First target 6.66
Second target 6.97
Third target 7.41

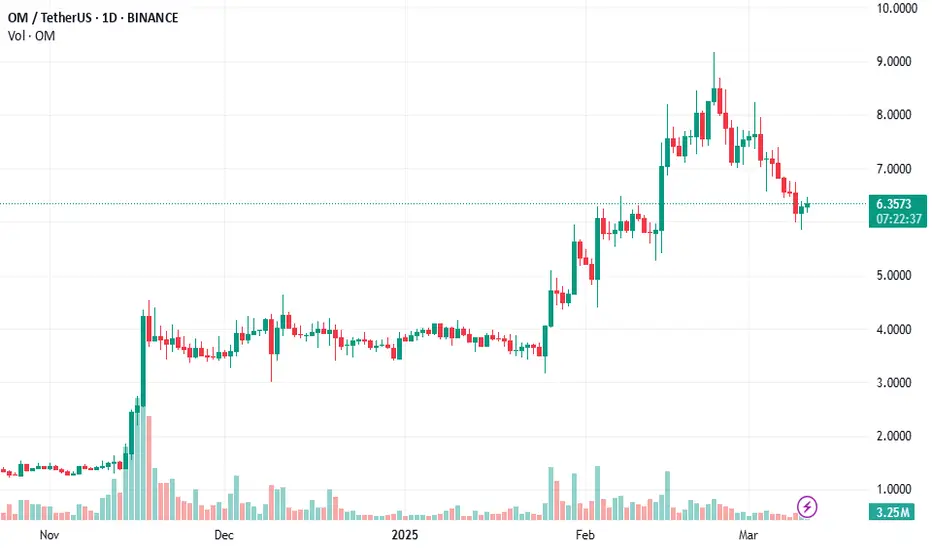
$OM Holding StrongMomentum shift incoming on $OM.
Price holding above $6.80, RSI grinding up, and OBV ticking higher.
That’s positioning — not hype.

Whale Alert: Justin Sun’s Massive $OMUSDT Accumulation!Eyes on the prize!
justinsuntron just made a major BINANCE:OMUSDT accumulation straight from #Poloniex’s multisig.
Something’s brewing… and it’s BIG.

$OM Long RWA Momentum Building!
Longing BINANCE:OMUSDT —tech’s lit! Fibonacci support at $6.50, whale’s 21M buy ($140M) on @binance, Williams %R rebound.
In at $6.70, target $7.40, stop at $6.35.
RWA upside’s brewing—move fast! 👀🐋

Justin Sun Joins $OM – A Game-Changing Move?History doesn’t repeat, but smart moves do.
justinsuntron just took his first-ever step into $OMUSDT.
A strategic move? A long-term play? Either way, the game just changed.

$OM Long Setup—Targeting $7.60! Traders, I’m going long on $NASDAQ:OMUSDT—tech’s screaming! Bollinger squeeze at $6.60, whale’s 19M buy ($126.7M) on @binance, RSI at 55.
MANTRA’s RWA yields (15% APY) and DeFi growth are fire in 2025.
Jumping in at $6.68, eyeing $7.60—stop at $6.30. RWA’s the future, let’s ride this March wave! 🐋🔥

The Accumulation Game Begins: Justin Sun Enters $OMThe accumulation game is ON.
justinsuntron just made his first-ever move into $OMUSDT. Funds were sourced directly from #Poloniex’s multisig.
Are you seeing the bigger picture?

Justin Sun’s First $OM Accumulation from PoloniexBig players make big plays.
justinsuntron has officially joined the BINANCE:OMUSDT club, making his first accumulation straight from #Poloniex’s multisig.
If you know, you know.

$OM Long Set for $7.50Locking in a long on BINANCE:OMUSDT —tech’s on point! Ichimoku Cloud breakout, price at $6.70, volume spiking in March 2025.
I’m in at $6.72, targeting $7.50, stop at $6.40. RWA upside is real—join me now! 🐋🕉️

Justin Sun Secures His First $OM BagA billion-dollar mind doesn’t move randomly.
justinsuntron just secured his first-ever BINANCE:OMUSDT bag straight from #Poloniex’s multisig.
A strategic play? Or just the beginning?
