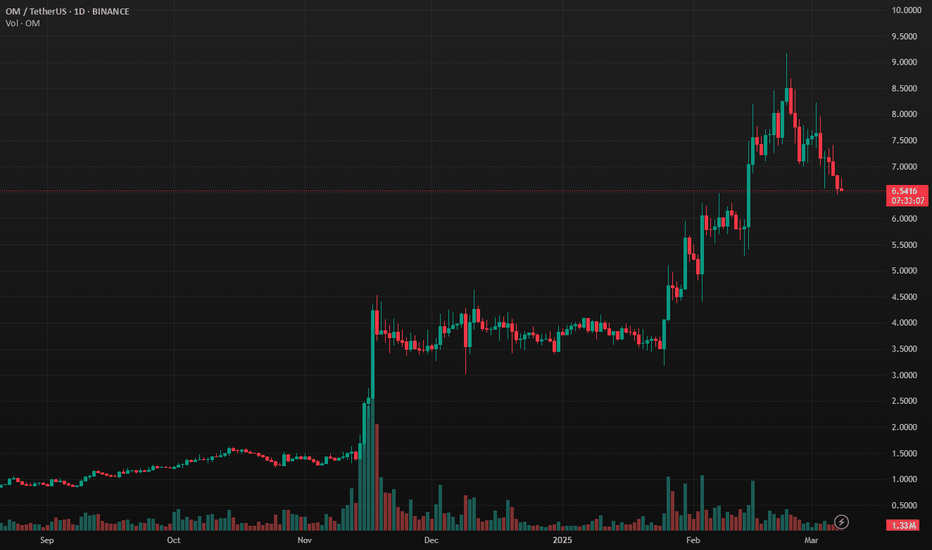
Justin Sun Bets Big on $OM – The Smart Money Move?Justin Sun Just Bet Big on BINANCE:OMUSDT — Here’s Why It Matters
After all the massive inflows & outflows this week…
Now Justin Sun — OG whale & one of the smartest traders — just added BINANCE:OMUSDT to his bags.
What does this tell us?
- Big money is accumulating
- Smart money is positioning
- Confidence in MANTRA as the RWA king
- OGs like Justin don’t move without a reason
BINANCE:OMUSDT in Top - 10, inevitable! 🔜
#OM #MANTRA #RWA #Whales #Justin
OMUSDT trade ideas
Big Money is Here: Justin Sun Enters $OMJustin Sun Just Entered BINANCE:OMUSDT — What Does He See? 👀
- Big wallets loading.
- Institutions aping.
- Real adoption happening.
- RWAs = multi-trillion $$$ market.
- Justin Sun just entered.
- Integrations with major exchanges
This ain’t just a coin. It’s THE L1 for RWAs — regulated, compliant, built different. 🕉️🔥
$10+ coming.
#CryptoNews #Binance #OM #MANTRA #RWA
Justin Sun Backs $OM – The RWA Boom Is Here!Justin Sun Just Added BINANCE:OMUSDT — What’s He Seeing That Others Aren’t?
Most people still don’t realize how massive #RWA will be.
This isn’t just hype—it’s a fundamental shift in finance.
And BINANCE:OMUSDT is leading it.
✅ The first regulated Layer 1 for RWAs
✅ Backed by institutions, real estate giants & sovereign funds
✅ Already laying the rails for trillions in tokenized assets
✅ Now Justin Sun stacks 250K BINANCE:OMUSDT fresh off Poloniex
When real-world value moves onchain, BINANCE:OMUSDT will be the bridge.
Top-10 incoming. Are you positioned yet? 👀
#Binance #Alts #MANTRA #OM #RWAs
OM/USDT : Do you know what is going to happen?hello guys
As you can see, this currency has strong spikes...
Now, according to the latest spike, we have identified good support ranges for you to buy step by step and move with it until the specified goals, of course, with capital management...
*Trade safely with us*
$OM Bullish pennantBINANCE:OMUSDT is currently doing a bullish pennant pattern after an explosive move from 1.67 area. A break of this pennant could send BINANCE:OMUSDT price parabolically to around 6.40 - 6.80 area, measured using the length of the pole in confluence with 2.618 fib level.
In a typical retrace on a continuation move towards the upside, volume tends to dry out, signalling that a move may be due sooner than later. In futures, BINANCE:OMUSDT.P O/I continue to hover around $14M which is a good sign given the sentiment of the market towards premium RWA projects, with a positive L/S ratio.
On the flipside, a break of the lower level will only continue the current ranging move of BINANCE:OMUSDT towards 3.30 - 3.50 area.
Given that the market is still focusing on BTC, BINANCE:OMUSDT will continue to move in a laggard fashion, therefore there is still time to find a long entry near 3.55 - 3.63 area. Once money shifts towards alts, this will propel BINANCE:OMUSDT to new ATHs.
As always, manage your risks.
GL!
- JD
$OMUSDT nearing completion of bullish flag patternBINANCE:OMUSDT is nearing completion of its bullish flag pattern, with the following confluence:
1. FVG Gap filled in confluence with .386 - .5 fib retracement level.
2. Decreasing volume on a pullback
3. Daily Stochastic RSI has bottomed out, and is about to flip towards the upside
Also, metrics show:
4. Margin long/short ratio on Spot steadily increasing from a low of 0.02 last Feb. 24, and is currently at 1.04 (borrowed long > borrowed short)
5. Futures long/short ratio increasing, currently at 0.62 from 0.17 last Feb. 16
6. Decreasing on exchange supply with significant Spot OM token withdrawn from exchange in the last week
Things to note:
7. Daily RSI is been cooling down, currently at 52.99 from an Overbought level of 77.21 last Feb. 23 during ATH price of 9.1051, signaling a continuation of uptrend
8. Daily MACD is currently bearish, with increasing strength, supporting the current short term pullback.
If the price of BINANCE:OMUSDT will breakout from its current bullish flag pattern, next target is set at around 12.24 - 13.14, between the height of the current pole and extended fib level of 2.618
OM/BTC ShortOM has gained attention as one of the premier RWA protocols in the crypto space. OM started at 500m market cap one year ago and today stands around 7B. This kind of growth is exciting, but against BTC I see it as unsustainable. Therefore, a mean reversion OM/BTC short trade has the potential to fall 50% over the next twelve months, regardless whether prices enter a bear or bull market.
Stop loss can be placed above the local high. Good luck in your trading.
OM | MANTRA | Bullish Cycle OVER?MANTRA has made leaps and strides towards a new ATH, whilst the rets of the market was trading lower for the past few weeks.
But it seems the buying pressure has run out, if we take a look at the technical indicators.
Interestingly enough, if we take a look at OM through the Weekly timeframe and we pull up the Fibonacci extension, the current cycle ended at exactly 2.618 - a significant marker in the Fib zones.
It is said that, after reaching 2.618, a retracement to 0.786 is probable. This would put us roughly at the major previous resistance zone before the ATH breakout:
The Moving Averages is another great place to watch for possible bounce zones:
After this correction (which could go even lower) the price could potentially bounce back, as it gears up for a new ATH. I'd be looking to buy from the 0.786 and lower, possibly as low as the $2 mark.
________________________
OKX:OMUSDT


