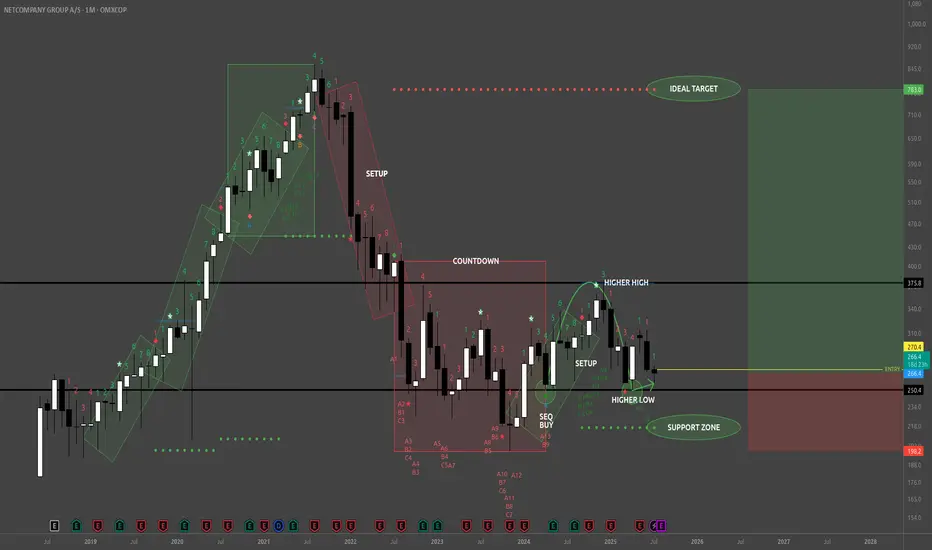
NETC - BuyReading the NETC Monthly chart from the left to right look at that remarkably strong bullish trend (green rotated rectangles) which spanned 3 consecutive TD 1-9 Setups. That's 9 strong months of uptrend culminating in the beginning of the bearish trend with a TD Sequential 13 Sell signal at the apex
Next report date
—
Report period
—
EPS estimate
—
Revenue estimate
—
10.4 DKK
470.20 M DKK
6.54 B DKK
37.80 M
About NETCOMPANY GROUP A/S
Sector
Industry
CEO
André Rafal Rogaczewski
Website
Headquarters
Copenhagen
Founded
2018
ISIN
DK0060952919
FIGI
BBG00KW6K3S7
Netcompany Group A/S engages in the provision of information technology services. It operates through the Public and Private segments. The Public segment consists of benefits and payment, citizen service, grant management, debt collection and refunds, case management, regulations, fillings and reporting, digital infrastructure, analytics and evaluation, and internal support service areas. The Private segment is involved in the following industry sectors insurance, pension, and banking; energy and utilities; transport and logistics; telecommunications and media; retail and wholesale; pharma and life science; and unions and unemployment insurance funds. The company was founded by André Rogaczewski, Claus Jørgensen and Carsten Krogh Gomard in 2000 and is headquartered in Copenhagen, Denmark.
Related stocks
Netcompany breakdown RSI oversold.
Sellers in line to get out.
Breakdown of consolidation zone.
No support left.

Netcompany A/S is falling but where is it gonna go ? As shown on the chart , we are deffently in a bear market on this one no douth about that.
But where is it gonna go next.
As the chart shown, we are on the 420-440 course and if that line dont hold we can see 377 but again the indicatores are very negative all aroundt and maybe even to much so an

NetCompany - LONG IdeaI would like to see the stock to bounce a little bit up before buying to confirm its gonna stop at the line.


See all ideas
Summarizing what the indicators are suggesting.
Neutral
SellBuy
Strong sellStrong buy
Strong sellSellNeutralBuyStrong buy
Neutral
SellBuy
Strong sellStrong buy
Strong sellSellNeutralBuyStrong buy
Neutral
SellBuy
Strong sellStrong buy
Strong sellSellNeutralBuyStrong buy
An aggregate view of professional's ratings.
Neutral
SellBuy
Strong sellStrong buy
Strong sellSellNeutralBuyStrong buy
Neutral
SellBuy
Strong sellStrong buy
Strong sellSellNeutralBuyStrong buy
Neutral
SellBuy
Strong sellStrong buy
Strong sellSellNeutralBuyStrong buy
Displays a symbol's price movements over previous years to identify recurring trends.
Frequently Asked Questions
The current price of NETC is 236.0 DKK — it has decreased by −1.50% in the past 24 hours. Watch NETCOMPANY GROUP A/S stock price performance more closely on the chart.
Depending on the exchange, the stock ticker may vary. For instance, on OMXCOP exchange NETCOMPANY GROUP A/S stocks are traded under the ticker NETC.
NETC stock has risen by 0.68% compared to the previous week, the month change is a −12.59% fall, over the last year NETCOMPANY GROUP A/S has showed a −14.18% decrease.
We've gathered analysts' opinions on NETCOMPANY GROUP A/S future price: according to them, NETC price has a max estimate of 350.00 DKK and a min estimate of 280.00 DKK. Watch NETC chart and read a more detailed NETCOMPANY GROUP A/S stock forecast: see what analysts think of NETCOMPANY GROUP A/S and suggest that you do with its stocks.
NETC reached its all-time high on Aug 23, 2021 with the price of 861.6 DKK, and its all-time low was 180.0 DKK and was reached on Jun 7, 2018. View more price dynamics on NETC chart.
See other stocks reaching their highest and lowest prices.
See other stocks reaching their highest and lowest prices.
NETC stock is 3.08% volatile and has beta coefficient of 0.35. Track NETCOMPANY GROUP A/S stock price on the chart and check out the list of the most volatile stocks — is NETCOMPANY GROUP A/S there?
Today NETCOMPANY GROUP A/S has the market capitalization of 10.69 B, it has increased by 2.98% over the last week.
Yes, you can track NETCOMPANY GROUP A/S financials in yearly and quarterly reports right on TradingView.
NETCOMPANY GROUP A/S is going to release the next earnings report on Aug 14, 2025. Keep track of upcoming events with our Earnings Calendar.
NETC earnings for the last quarter are 3.07 DKK per share, whereas the estimation was 3.05 DKK resulting in a 0.57% surprise. The estimated earnings for the next quarter are 2.42 DKK per share. See more details about NETCOMPANY GROUP A/S earnings.
NETCOMPANY GROUP A/S revenue for the last quarter amounts to 1.74 B DKK, despite the estimated figure of 1.71 B DKK. In the next quarter, revenue is expected to reach 1.70 B DKK.
NETC net income for the last quarter is 121.70 M DKK, while the quarter before that showed 117.80 M DKK of net income which accounts for 3.31% change. Track more NETCOMPANY GROUP A/S financial stats to get the full picture.
NETCOMPANY GROUP A/S dividend yield was 0.00% in 2024, and payout ratio reached 0.00%. The year before the numbers were 0.00% and 0.00% correspondingly. See high-dividend stocks and find more opportunities for your portfolio.
As of Aug 11, 2025, the company has 6.94 K employees. See our rating of the largest employees — is NETCOMPANY GROUP A/S on this list?
EBITDA measures a company's operating performance, its growth signifies an improvement in the efficiency of a company. NETCOMPANY GROUP A/S EBITDA is 1.16 B DKK, and current EBITDA margin is 16.79%. See more stats in NETCOMPANY GROUP A/S financial statements.
Like other stocks, NETC shares are traded on stock exchanges, e.g. Nasdaq, Nyse, Euronext, and the easiest way to buy them is through an online stock broker. To do this, you need to open an account and follow a broker's procedures, then start trading. You can trade NETCOMPANY GROUP A/S stock right from TradingView charts — choose your broker and connect to your account.
Investing in stocks requires a comprehensive research: you should carefully study all the available data, e.g. company's financials, related news, and its technical analysis. So NETCOMPANY GROUP A/S technincal analysis shows the sell today, and its 1 week rating is sell. Since market conditions are prone to changes, it's worth looking a bit further into the future — according to the 1 month rating NETCOMPANY GROUP A/S stock shows the sell signal. See more of NETCOMPANY GROUP A/S technicals for a more comprehensive analysis.
If you're still not sure, try looking for inspiration in our curated watchlists.
If you're still not sure, try looking for inspiration in our curated watchlists.