TradeCityPro | ONDO Builds Strength Beneath Key Supply Barrier👋 Welcome to TradeCity Pro!
In this analysis, I want to review the ONDO coin for you — one of the RWA projects, currently ranked 37th on CoinMarketCap with a market cap of $2.93 billion.
📅 Daily Timeframe
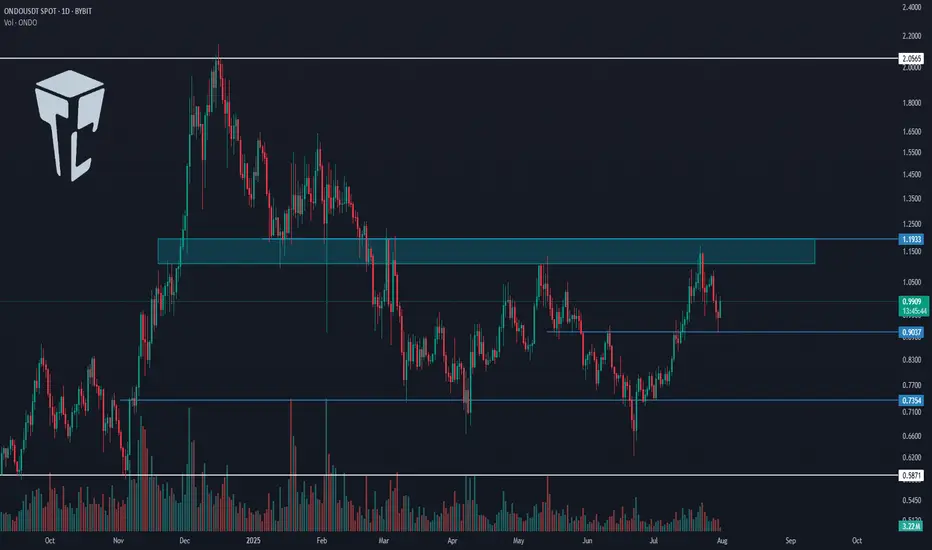
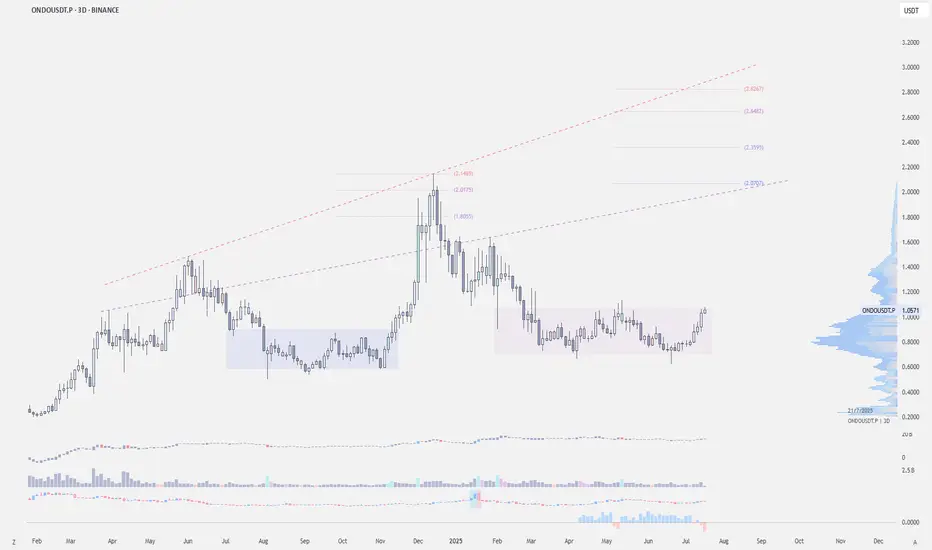
In the daily timeframe, as you can see, this coin has formed a range box between the levels of 0.7354 and 1.1933, and the price is currently sitting in the upper half of this box.
✔️ At the moment, the price is hovering around 0.9037, and it’s forming a higher low above 0.7354. If this low gets confirmed, the probability of breaking above 1.1933 increases.
⭐ The 1.1933 zone is a very significant supply level that was previously acting as support in late 2024, and after being broken, has since acted multiple times as resistance.
📊 If this area breaks, we can open a long position, or even buy this coin in spot. Personally, if this trigger is broken, I’ll open a long-term long position.
✨ The target for this position is 2.0565, and once the price reaches this level, we can take profits and consider a spot buy.
📝 Final Thoughts
This analysis reflects our opinions and is not financial advice.
Share your thoughts in the comments, and don’t forget to share this analysis with your friends! ❤️
ONDOUSDT trade ideas
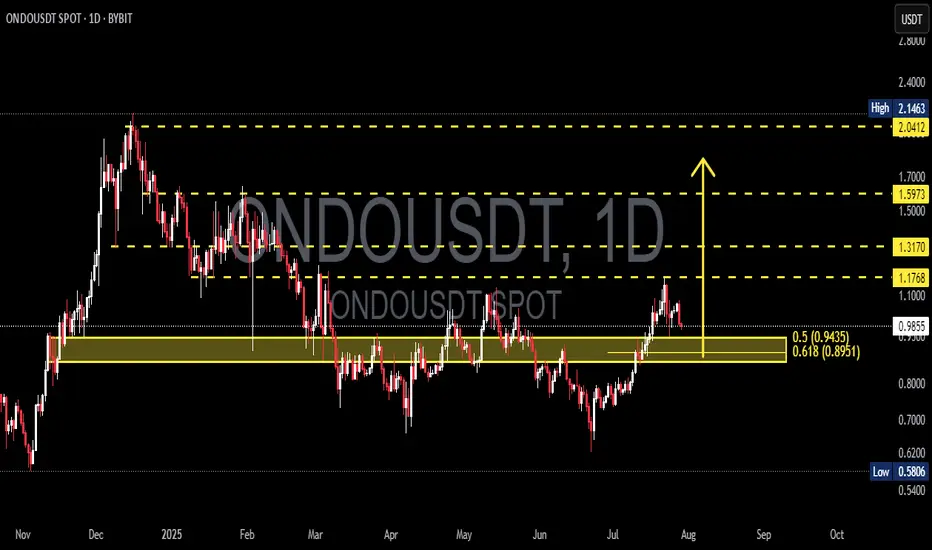
ONDOUSDT at a Critical Fibonacci Zone! Will Move Toward $2+?ONDOUSDT is currently trading at a critical technical zone — the Fibonacci Retracement Golden Pocket (0.5–0.618) — following a significant upward rally. Historically, this zone often acts as a high-probability reversal area, or at the very least, a zone for major consolidation before the next big move.
---
🧠 Market Structure & Price Action
After reaching a local high near $1.17, price retraced and is now approaching the key support zone between $0.9435 (Fib 0.5) and $0.8951 (Fib 0.618).
This zone also coincides with a previous strong resistance, which could now act as new support (role reversal).
Current price action shows selling pressure, but there is no confirmed breakdown from the Golden Pocket yet.
---
🧩 Pattern Recognition & Key Levels
Potential Reversal Pattern: Look for a bullish falling wedge or descending channel on lower timeframes as a signal for reversal.
Demand Zone (Yellow Box): The zone between $0.8951–$0.9435 is reinforced by horizontal price structure support.
Layered Resistance Levels:
$1.1768 → Recent swing high
$1.3170 → Mid-range resistance
$1.5973 → Psychological and retracement target
$2.0412 → Range top / full recovery zone
Minor Support: If the Golden Pocket fails, potential downside targets include $0.70 and the major low at $0.5806.
---
📈 Bullish Scenario
✅ Strong bounce from the Golden Pocket
✅ Bullish candlestick confirmation (e.g., bullish engulfing or pin bar)
✅ Rising volume showing buyer presence
✅ Break above $1.1768 would signal continuation toward:
🎯 Target 1: $1.3170
🎯 Target 2: $1.5973
🎯 Target 3: $2.0412 (full structural recovery)
---
📉 Bearish Scenario
❌ If price breaks below $0.8951 with a strong bearish candle and high volume:
The structure shifts bearish, increasing risk of a drop to $0.70 – $0.62
Worst-case scenario: retest of $0.5806, the major bottom
Bullish structure invalidated upon confirmed breakdown
---
🎯 Strategy & Takeaway
ONDOUSDT is currently in a "make or break" zone. The Golden Pocket between $0.895–$0.943 could either:
Act as a springboard for the next bullish leg,
Or fail, triggering a deeper correction.
Traders should wait for confirmation via:
Candlestick patterns
Volume breakout/inflow
Break above or below the key structure
This area offers a high-reward, controlled-risk setup for swing traders, with invalidation just below the Golden Pocket.
---
📌 Summary of Key Levels
Level Description
$0.9435 Fibonacci 0.5 (support)
$0.8951 Fibonacci 0.618 (Golden Pocket)
$1.1768 Minor resistance
$1.3170 Mid-level resistance
$1.5973 Bullish target
$2.0412 Major resistance / recovery top
$0.5806 Extreme support (macro low)
#ONDOUSDT #CryptoTechnicalAnalysis #GoldenPocket #FibonacciLevels #CryptoTrading #SupportResistance #BullishSetup #BearishScenario #SwingTrade #AltcoinAnalysis
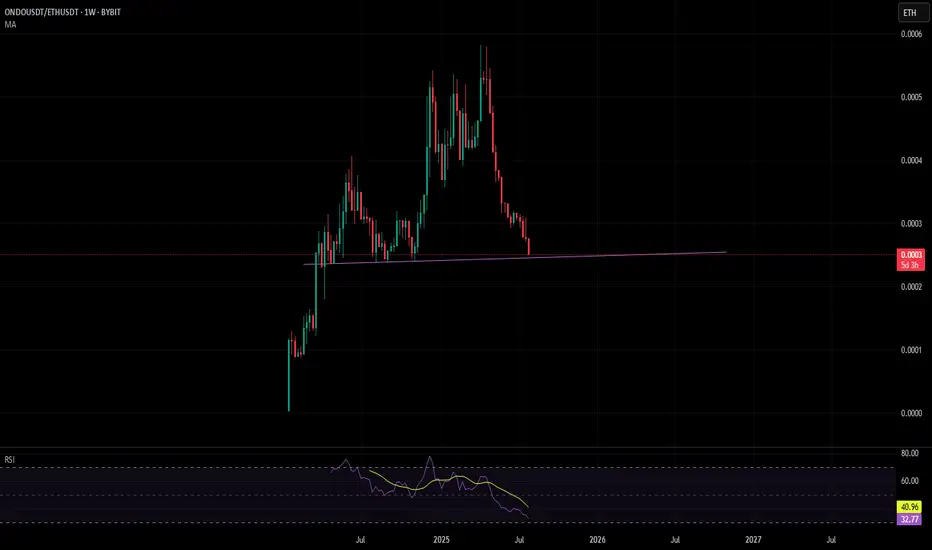
ONDOETH WeeklyOndo-ETH is nearing a nice clean support level.
I will buy ondo here and sell it at the top against ETH
ondo bullish🔹 Harmonic Pattern (Possibly a Gartley or Bat)
The chart shows a clear ABCD pattern, suggesting a potential reversal zone around point D.
• A → B → C → D structure is visible.
• Based on Fibonacci ratios:
• AB ≈ 0.75 retracement (close to Bat or Gartley pattern)
• BC ≈ 1.32 extension, which also fits harmonic rules
📌 Point D is around 1.1077, which is likely a resistance/reversal area.
⸻
🔹 RSI (Relative Strength Index)
• RSI is around 50, indicating neutral momentum (not overbought or oversold).
• It’s starting to curve upward, which could signal a build-up in buying strength.
⸻
🔹 MACD
• A bullish crossover is visible (MACD line crossing above the signal line).
• Histogram turning positive = early bullish signal.
⸻
🔹 Summary & Trade Scenarios
✅ Bullish Scenario:
• If price breaks above 1.1077 with strong volume, it may target 1.15 or higher.
• Confirmation needed: candle close above D zone (1.1077) with volume support.
❌ Bearish Scenario:
• If price retests 1.1077 and fails, it might reverse toward support around 1.00 or even 0.95.
• Watch for bearish divergence or rejection candles near D.
⸻
🎯 Suggested Strategy:
• Long setup: If price breaks and holds above 1.108, target 1.15, stop-loss below 1.05
• Short setup (more conservative): If price rejects from 1.1077, consider short with target 1.00

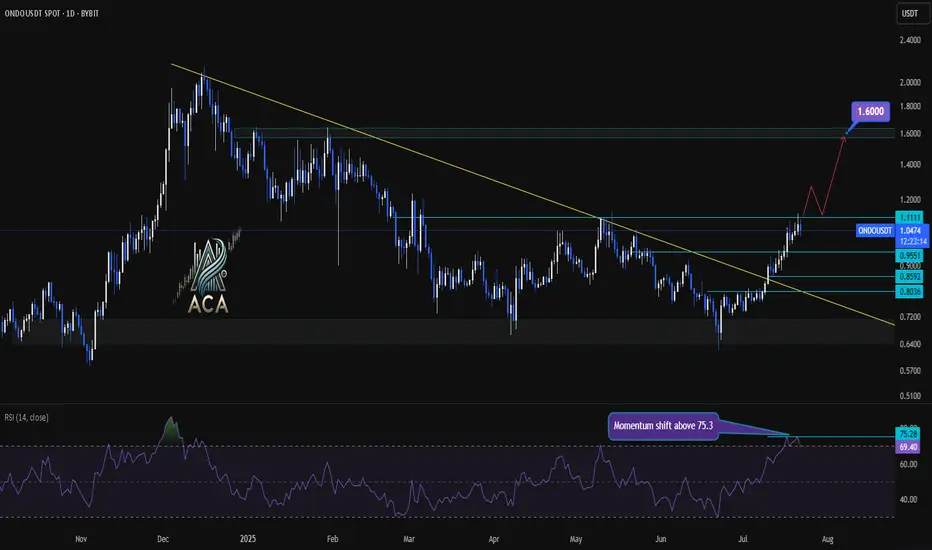
ONDOUSDT Daily Chart Analysis | Momentum Shift & Breakout LevelsONDOUSDT Daily Chart Analysis | Momentum Shift & Breakout Levels
🔍 Let’s dive into the ONDO/USDT daily chart and break down the latest momentum signals, key breakout areas, and targets for bulls.
⏳ Daily Chart Overview
The daily trend shows significant recovery after prolonged downward pressure, with price action now testing critical resistance levels. A key descending trend line has recently been challenged, highlighting a potential shift in market structure.
🔺 Bullish Setup
- Momentum Trigger: The RSI has closed above 75.3, signaling a strong momentum shift and upping the odds for continued upside.
- Breakout Confirmation: Watch for a daily candle close above the $1.1111 resistance level. This would confirm a bullish breakout and could serve as a solid trigger for further upside.
- Trend Line Dynamics: The price has decisively broken above the major descending trend line, which had capped rallies for months—removing a significant area of supply and emboldening bulls.
- Upside Target: Once confirmed, this setup opens the door for an advance towards the $1.60 area, where the next major resistance sits.
📊 Key Highlights
- Daily RSI closing above 75.3 reflects strong market momentum and buyer dominance.
- A daily candle close above $1.1111 can be used as a bullish trigger.
- The long-term descending trend line has been broken, indicating a major momentum shift.
- Immediate upside target stands at $1.60, representing a clear resistance level for profits or further evaluation.
🚨 Conclusion
Momentum is clearly shifting in favor of the bulls as technical barriers fall by the wayside. For traders looking to position long, confirmation above $1.1111 combined with the powerful RSI reading sets the stage for a move towards $1.60—keep these levels on your radar as the setup plays out!
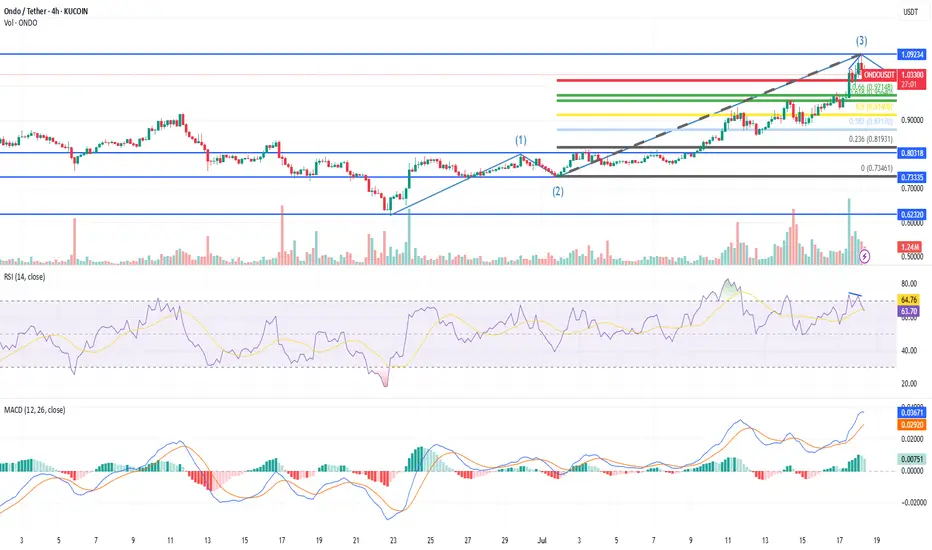
ONDO Elliott Wave AnalysisHi everyone! 👋
I want to share my current ONDO/USDT count on the 4H chart to get feedback from more experienced traders. Any comments, corrections, or tips are very welcome!
🟦 Where I started counting:
Wave (1): Started from around $0.62320 and topped at $0.80318
Wave (2): Retraced to $0.73807, around 36% of Wave 1 — quick and sharp, likely a zigzag
✅ So far, Wave 2 seems shallow and impulsive, which sets up for alternation in Wave 4.
🟩 Wave (3) development:
Wave 3 moved from $0.80318 → $1.09251
Strong volume and price action — fits well with what Elliott Theory defines as a powerful third wave
Wave 3 extension = about 1.6x Wave 1 — matches guidelines
📌 Based on this, I’ve marked Wave (3) completed at $1.09251
🟨 Now: Wave (4) Correction Zone
According to the Elliott Wave alternation rule:
Since Wave 2 was shallow and sharp, Wave 4 is expected to be deeper and more sideways. But BTC ATH bull run panic and hype all can change.
Here are the key retracement zones I’m watching for Wave 4:
| Retracement | Level | Meaning |
| ----------------- | --------------------- | -------------------------------------- |
| **0.382** | $0.98296 | Minor pullback, strong trend continues |
| **0.5** | $0.94884 | Common zone |
| **0.618** | $0.91472 | Deep but acceptable |
| ❌ Below $0.80318 | Invalidates structure | |
🟥 Wave (5) Projection:
Assuming Wave 4 ends shallow or deep, here are potential Wave 5 targets:
| Wave 4 End Price | TP1 (0.618 ext) | TP2 (1.0 ext) | TP3 (1.618 ext) |
| ---------------- | --------------- | ------------- | --------------- |
| \$1.09234 | **\$1.203** | \$1.272 | \$1.382 |
| \$1.04233 | **\$1.153** | \$1.222 | \$1.332 |
I’ll be watching RSI/MACD and volume to confirm when Wave 4 ends before entering Wave 5.
🙏 Open to Feedback!
I’m still learning and really enjoying Elliott Wave theory, so I’d love to hear from the TradingView community:
Do the waves look valid to you?
Would you count this any differently?
Any tips on catching the reversal of Wave 4?
Is the Wave 2 structure truly a zigzag, or am I missing something?
Thanks for reading — and I appreciate any support, corrections, or insights you can share. 📈💬
Let’s learn together!
$ONDO Breakout from Accumulation Zons pump is coming?
LSE:ONDO has officially broken out above the neckline after months of consolidation. The structure reflects a classic inverse head & shoulders pattern, signaling a strong bullish trend reversal.
🔸 Support at $0.92 – $0.85:
This zone previously served as a key resistance and is now acting as local support. while $0.54 is the ultimate invalidation level for bulls.
🔸 Upside Target: $2.00 – $2.50
With the breakout confirmed, the next logical targets lie near previous highs. If the retest holds, we could see a steady move toward $2.00 and potentially $2.50 in the coming weeks.
🔸 Risk Level at $0.54:
A weekly close below $0.54 would put the breakout in question. New entries should use a tight stop loss below this zone to manage risk effectively.
🔸 Outlook:
✅ Already holding? Hold strong and trail stops as price moves up.
🔄 Missed entry? A clean retest around $0.85 – $0.92 would be a high-probability re-entry zone.
📈 Watch for increasing volume and bullish structure on the retest to confirm continuation.
ONDO Bullish structureOndo is back to bullish scenario. We can see long accumulation more then 100 days. As you can see price 0.9 is back and then bullish coming. So 0.85 and 0.9 have to hold and we can buy the dip.
Keep in mind if Ethereum start to attack ATH, Eth ecosystem will grow much higher. So watch this level in next couple weeks and months.
Ondo (ONDO): Reached Another Pump Zone | Good Entry Right HereOndo coin reached the local liquidity trend, where reaching this area was signaling us of upcoming smaller buyside movement.
So that's what we are looking for right now as well, a healthy upward movement towards our major target area at least.
Swallow Academy

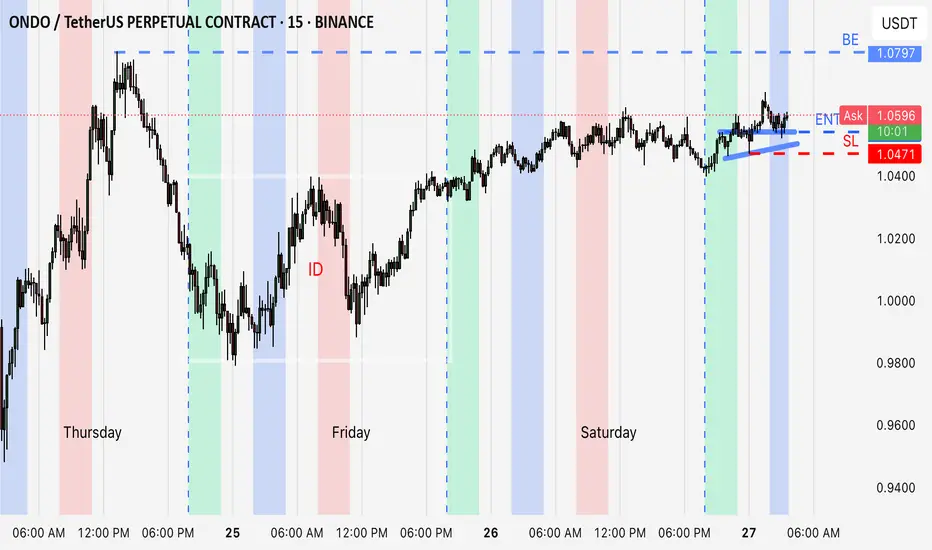
Inside day breakoutBouncing off the 200ma o. The daily timeframe. It sets up a triangle in Asia, broken out in Fatima and pulls back in London , looking to hold till close, moving stop loss to breakeven during the process
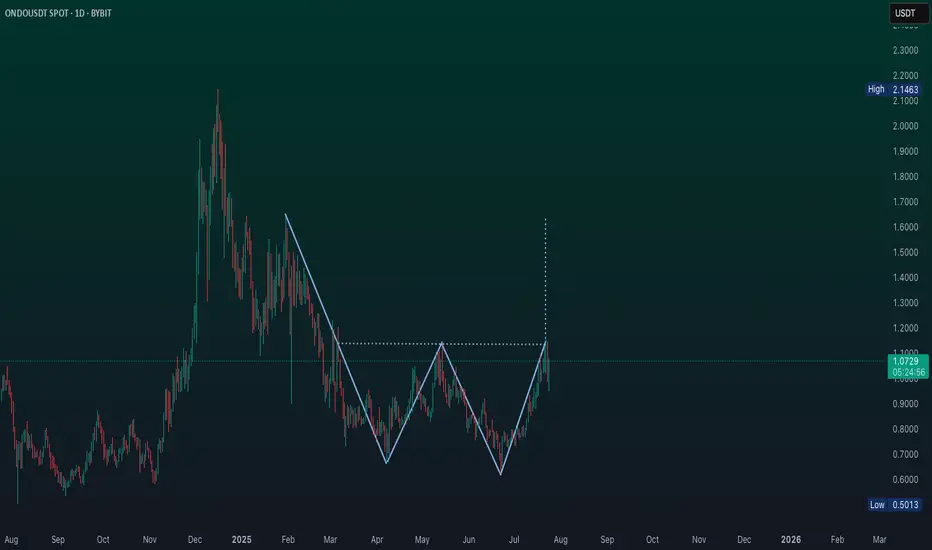
ONDO looks ready for a strong move- next stop could be $2.00+#ONDO 5.1% 24-hour price gain reflects ETF speculation, bullish technicals, and rising institutional interest in RWA tokenization.
21Shares’ CRYPTOCAP:ONDO ETF filing sparked institutional optimism
Double-bottom pattern signals bullish reversal
RWA narrative momentum amplifies demand
ONDO looks ready for a strong move- next stop could be $2.00+
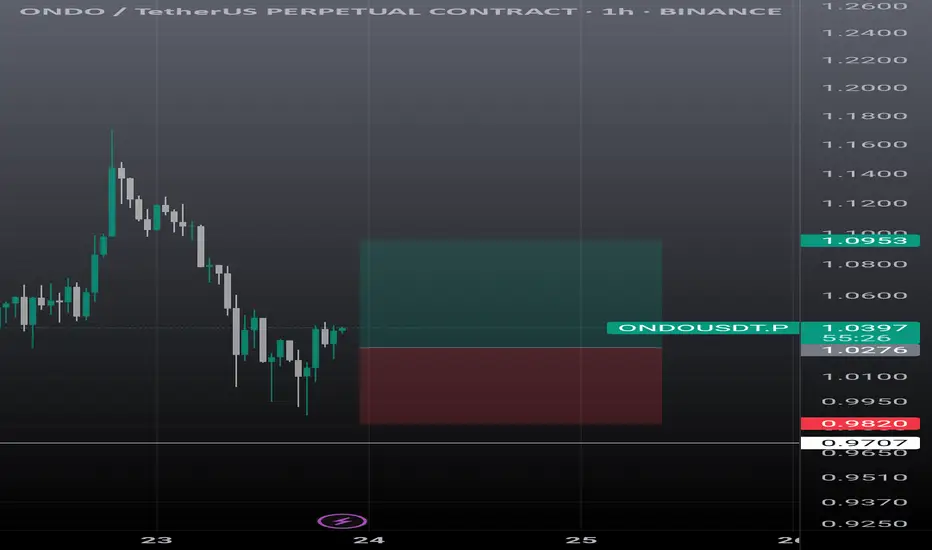
Ondo usdt scalp trade.First entry at current market price, and second one is mentioned, sl just below today low. Tp is mentioned.
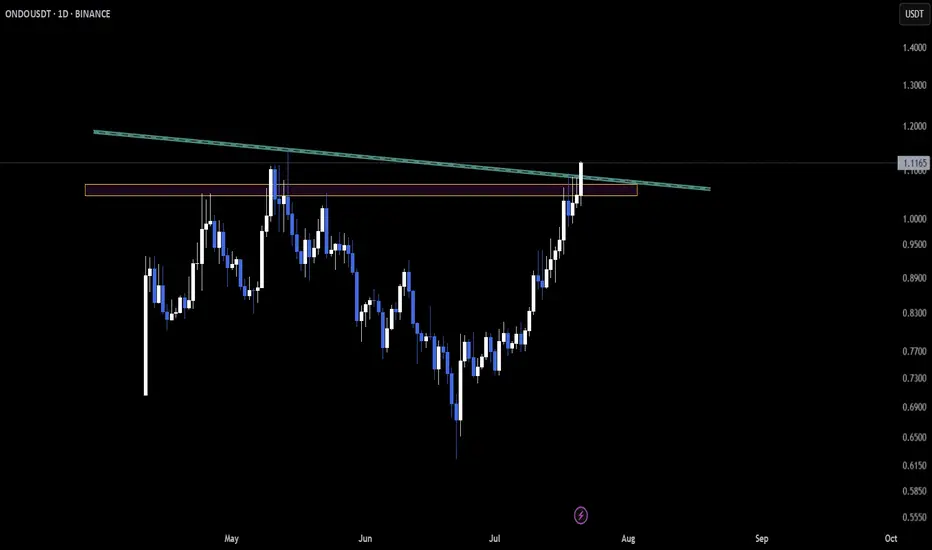
ONDO – Breaking Out of Compression on the 4H ChartLSE:ONDO is showing fresh strength as it breaks above the descending trendline on the 4-hour chart 📈.
This move signals a shift in short-term momentum, potentially setting the stage for a stronger bullish push if the breakout holds 🔥.
Price action here is crucial—watch for follow-through to confirm whether this is just a spike or the beginning of a larger move 🚀.
Stay alert as this setup continues to unfold 👀.
$ONDO For A CondoBYBIT:ONDOUSDT is showing one of the cleanest structures among altcoins right now — attempting to breakout from its accumulation.
We have a strong recovery off the local bottom, reclaiming $1 and showing signs of strength. Could retest $2 or even higher till $2.8
Catalysts:
— U.S. crypto legislation highlights @OndoFinance as institutional-grade
— BNB Chain to integrate tokenized U.S. stocks via Ondo
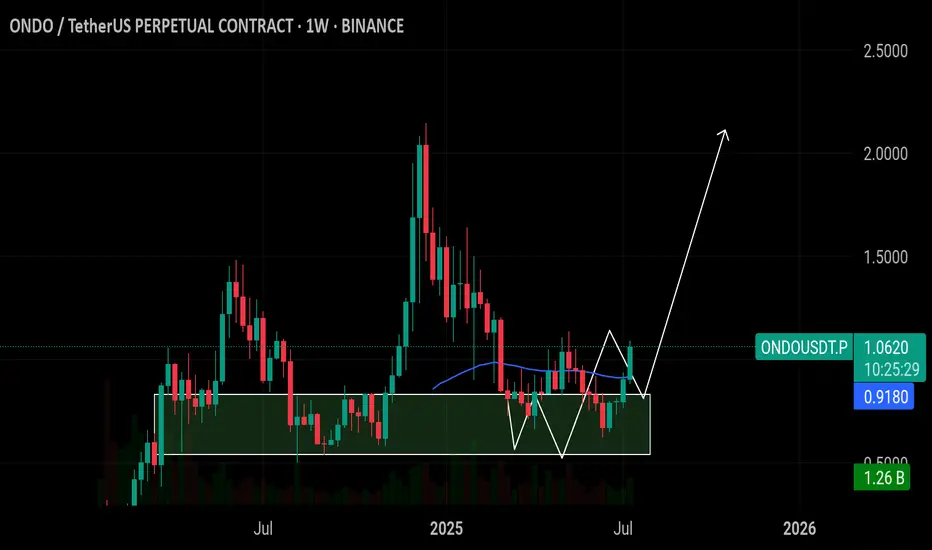
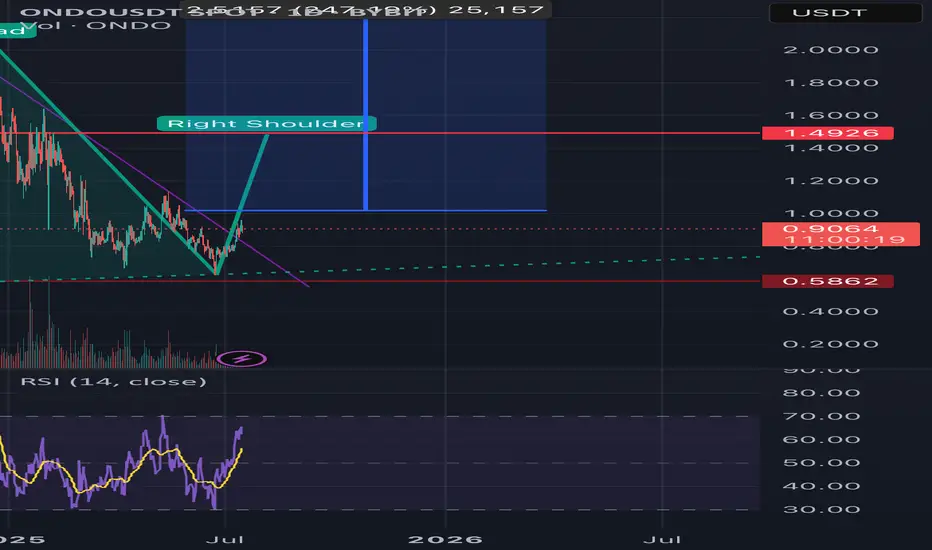
OndoBullish Reversal in Play – ONDO/USDT Weekly Chart
A clear Inverse Head and Shoulders pattern is forming on the weekly timeframe.
Price is currently breaking out of the neckline with strong momentum.
🔹 Left Shoulder: Formed with consistent volume support
🔹 Head: Deep correction followed by strong recovery
🔹 Right Shoulder: Higher low formation with bullish pressure
📈 Potential Target: $2.51 (+247%)
🛡️ Support Zone: ~$0.58
If this breakout confirms with weekly close above the neckline (~$0.90–$1.00),
we could be seeing the start of a major bull wave.
#ONDO #CryptoAnalysis #InverseHeadAndShoulders #Altseason #Breakout
Ondo: The Bullish Wave is Over? 410% - 579% Profits PotentialONDOUSDT managed to produce three weeks closing green with the last one conquering EMA13. When this happened back in November 2024 there was a period of continued growth. Look at it in this way; the week is young and the market is taking a break, growth will resume in a matter of days. This same week more green and continued green long-term.
When ONDOUSDT broke above EMA13 last year, it produced a total of six weeks of straight up. Now, back then we were looking at a small jump, today we are looking at a very strong bullish impulse. The 2025 bull market in full force.
Three green weeks is only the start. We are about to experience 12-24 weeks of bullish action. We are looking at the bottom, bullish momentum is yet to grow. It is still early, but early won't be a reality for too long. Buy and hold.
We have two targets that are interesting: 410% and 579%. These can be hit within 3 to 6 months. Allow for retraces and swings on the way up.
Namaste.

Ondo USDT SCALP TRADEIF this 4hr fvg breaks then I will look for short, otherwise expecting to hold this level and wipe out previous liquidation.

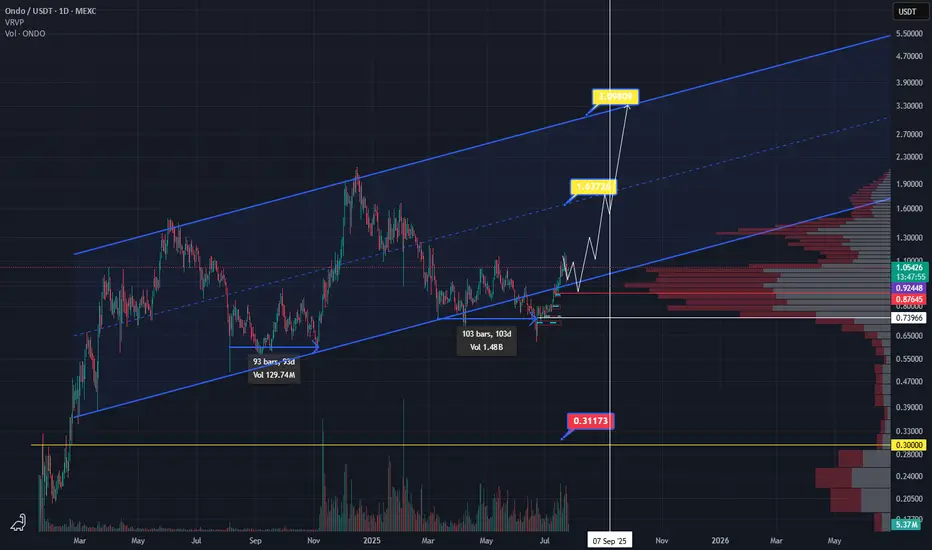
Buy Trade Strategy for ONDO: Bridging Traditional FinanceDescription:
This trading idea focuses on ONDO, a cryptocurrency that sits at the intersection of traditional finance and decentralized finance (DeFi). As the native token of Ondo Finance, ONDO powers a platform that aims to bring real-world assets—such as bonds and treasuries—onto the blockchain, enabling institutional-grade investment access for a broader audience. With increasing regulatory clarity around tokenized securities and rising demand for stable yield-generating products, ONDO is well-positioned to benefit from the convergence of conventional finance and DeFi innovation.
The project’s focus on compliance, transparency, and sustainable yield sets it apart in a crowded market. However, the crypto space remains volatile, and ONDO’s value is influenced by broader market conditions, regulatory dynamics, and investor sentiment.
Disclaimer:
This trading idea is for educational purposes only and should not be considered financial advice. Trading or investing in cryptocurrencies like ONDO carries significant risks, including the possibility of total capital loss. Always conduct your own due diligence, consider your personal financial situation, and consult a financial advisor before making any investment decisions. Past performance is not a reliable indicator of future results.

ONDO/USDT Breakout Watch – Reversal Incoming
🔍 Overview:
The ONDO/USDT pair is currently at a critical inflection point. After months of being suppressed in a downtrend, price action is now testing a major descending trendline that has capped the market since the peak in December 2024. A breakout here could be the beginning of an explosive bullish phase — but failure might confirm further downside.
📉 Pattern: Descending Trendline Compression
ONDO has been forming consistent lower highs, creating a clear descending trendline structure.
Price is now pressing against this resistance, attempting a breakout with a strong 2D candle.
A confirmed breakout will occur once ONDO closes above $0.916 on the 2D chart, which also acts as a horizontal resistance.
✅ Bullish Scenario – The Start of a Mid-Term Reversal?
If the breakout is confirmed, we could see strong upward momentum, as there’s relatively little resistance in the upper zones.
🎯 Potential Targets:
1. $1.11 – First psychological and technical resistance.
2. $1.327 – Previous consolidation zone from Feb–Mar 2025.
3. $1.577 – Major supply zone before the heavy correction started.
4. $2.045 - $2.145 – All-time high area, the ultimate mid-to-long-term target.
📈 Note: Although not shown in this chart, RSI is likely leaving oversold territory, supporting the bullish momentum shift.
❌ Bearish Scenario – Classic Bull Trap Ahead?
If price fails to break and close above the trendline and $0.916, this could turn into a fakeout or bull trap.
📉 Possible downside levels:
$0.8399 – Minor support currently holding.
$0.70 – Strong horizontal demand zone.
$0.53 – Long-term support base, potential double bottom zone.
If momentum fades here, ONDO could revisit these lower areas before finding a true bottom.
🧠 Sentiment & Trading Strategy:
Breakout confirmation: Wait for a solid 2D candle close above the descending trendline and $0.916. Look for volume spike.
Conservative strategy: Enter on break + retest of the trendline, with SL below $0.83 and multi-level TPs.
Aggressive strategy: Enter on the initial breakout with dynamic trailing stops and resistance-based targets.
🏁 Conclusion:
ONDO/USDT is at a make-or-break moment. A confirmed breakout from this long-term descending structure may trigger a strong reversal with over 100% potential upside. However, if the market rejects this breakout attempt, it could extend its bearish trajectory.
Patience, confirmation, and disciplined risk management are key here.
📌 Key Levels to Watch:
Support: $0.8399 – $0.70 – $0.53
Resistance: $0.916 – $1.11 – $1.327 – $1.577 – $2.045 – $2.145
#ONDO #ONDOUSDT #CryptoBreakout #BullishSetup #AltcoinAnalysis #CryptoReversal #TradingViewSignals #TechnicalBreakout #DescendingTrendline #PriceAction

Ondo Scalp trade take with sl , this is a 5m scalp trade, So take it at your own risk with small amount

#ONDO bounce from POINT OF CONTROL, targeting RANGE HIGHONDO found support at it's POC on the daily. if BTC.D lets it, it will want to head towards it. range high. (also VAH)
This isn't ondo specific, rather a case of BTC loses 108500 or also finds support there and invalidates its lower high pattern, to head towards ath.

ONDOUSDT Long SetupONDOUSDT is approaching 472 day support trendline. I am expecting a deviation from the trendline. In an ideal case looking to long from 0.62$ - 0.68$ range in portions. Lets see how it plays out.
Note: This is not a financial advise please DYOR

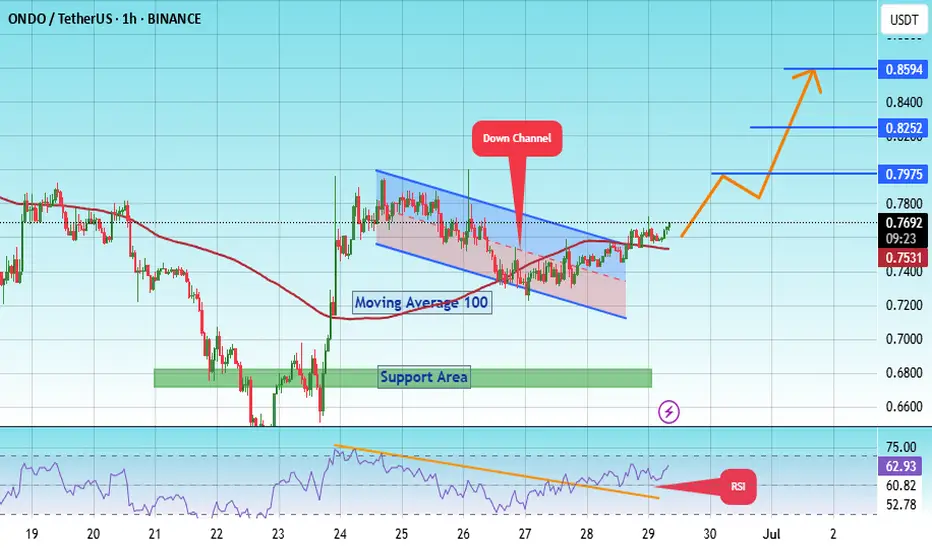
#ONDO/USDT#ONDO
The price is moving within a descending channel on the 1-hour frame, adhering well to it, and is heading for a strong breakout and retest.
We have a bounce from the lower boundary of the descending channel. This support is at 0.7220.
We have a downtrend on the RSI indicator that is about to be broken and retested, supporting the upside.
There is a major support area in green at 0.6757, which represents a strong basis for the upside.
Don't forget a simple thing: ease and capital.
When you reach the first target, save some money and then change your stop-loss order to an entry order.
For inquiries, please leave a comment.
We have a trend to hold above the 100 Moving Average.
Entry price: 0.7975
First target: 0.7975
Second target: 0.8252
Third target: 0.8600
Don't forget a simple thing: ease and capital.
When you reach the first target, save some money and then change your stop-loss order to an entry order.
For inquiries, please leave a comment.
Thank you.