Ondo Following The Macro TrendA New Era of Financial Inclusivity, Onchain🔗
#ONDO is rejecting the lower bound of its macro trend!
For the bulls to take over in the long term and kick off the next impulse move, a breakout above the $1 round number is needed.📈
ONDOUSDT trade ideas

ONDOUSDTConsidering the intersection of the volume range and VWAP and a valid bullish trendline and price support from this range, I consider this a good opportunity to enter this asset. I wanted to share with you friends.

ONDO Range Play: Breakout Confirmed, Eyes on $1.20+ONDO/USDT – 2D Chart Analysis
ONDO has broken above a falling trendline while continuing to trade within a broader sideways range. The breakout occurred near the mid S/R zone around $0.90–$0.95, which is now acting as a potential pivot level.
The price is attempting to reclaim momentum after a period of lower highs and sideways compression. A sustained move above the mid-range could open the path toward the upper resistance zone near $1.20–$1.30. However, if the breakout fails and price falls back below $0.90, it may revisit the lower range support around $0.70.
This is a key zone to watch for continuation or rejection.
DYOR, NFA

ONDO Falling Wedge + Bullish DivergenceBITGET:ONDOUSDT is compressing inside a falling wedge, now trading near key support. Signs of potential reversal are building.
🔹 Key Observations
• Pattern: Falling wedge (bullish bias)
• Support: Price is holding just above the ~$0.68–$0.75 demand zone
• Volume: Declining throughout the wedge – typical pre-breakout behavior
• RSI: Bullish divergence forming + compression under 50, often seen before breakouts
🔸 What to Watch
• Breakout trigger: Daily close above wedge resistance (orange trendline), ideally with volume
• Target zones: $1.30 to $1.60, then $1.90 to $2.10 (prior S/R levels)
• Invalidation: Breakdown below the green demand zone ($0.68)
⚠️ As always, confirmation matters – no breakout yet. But the setup is clean and worth watching closely.

ONDOUSDT 1DONDO ~ 1D Analysis
#ONDO Buy after successfully penetrating the resistant line of this pattern, with a short -term target of at least 10%+.

ONDO looking for that reversal. Be patientONDO in a falling wedge at support. The class A bullish divergence on momentum and trend oscillator presents good data for follow-through. However, a proper pivot structure defined by a CHOCH would be epic.
Full TA: Link in the bio

ONDO Long Spot Trade Setup – Bullish Divergence PotentialONDO is showing relative strength amid the broader altcoin pullback, holding key levels and now pulling into the $0.50 support zone. This area lines up for a possible RSI bullish divergence, which could spark the next leg up.
📌 Trade Setup:
Entry Zone: ~$0.50
Take Profit Targets:
🥇 $0.85
🥈 $1.13
🥉 $1.34
Stop Loss: Daily close below $0.42

#ONDO/USDT Analysis 📊 #ONDO/USDT Analysis 📊
LSE:ONDO is looking like a sleeping giant 💤
Currently consolidating — all eyes on that Diagonal Trendline breakout for a potential long setup!
🛒 Personally accumulating #ONDOUSDT on spot — staying bullish here.
📍Local Resistance: PWH $0.9565

Is ONDO Gearing Up for a Massive Breakout or Just a Bull Trap?Yello, Paradisers! Is #ONDO setting up for a bullish explosion, or is this just the calm before another dump? Here's what the current price action is signaling, and why this zone could be the final opportunity before a major move…
💎ONDOUSD has remained one of the strongest-performing altcoins, even amid broader market corrections. Since peaking in December, however, it has entered a healthy corrective phase. Currently, the price is forming a falling wedge pattern, and the ABC zigzag correction appears to have completed — an early sign of potential trend reversal.
💎#ONDOUSDT is currently consolidating above a moderate support zone between 0.766 and 0.70, a level that has held firmly since early March. This repeated defense of support, along with the completed correction, is reinforcing the potential shift in market sentiment.
💎If bullish momentum starts building, price is likely to aim towards the descending resistance around the 0.90 level. A confirmed breakout above this area would flip market structure bullish, potentially igniting a trend continuation toward the next resistance range between 1.10 and 1.20.
💎Should this breakout sustain and strength remain, ONDO could target the strong resistance zone between 1.40 and 1.50, which also aligns with the 50% Fibonacci retracement — a critical level where sellers are likely to return.
Paradisers, strive for consistency, not quick profits. Treat the market as a businessman, not as a gambler.
MyCryptoParadise
iFeel the success🌴

#ONDO/USDT#ONDO
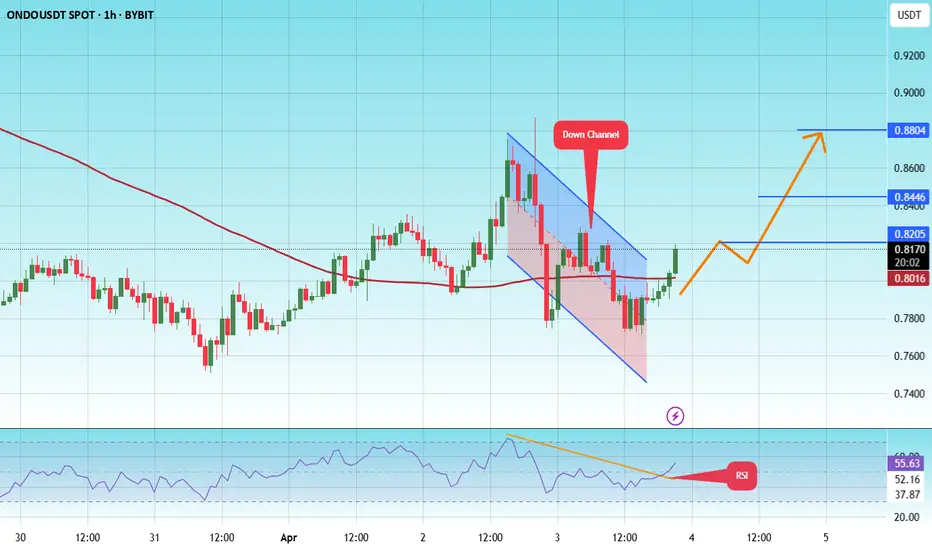
The price is moving within a descending channel on the 1-hour frame and is expected to continue upward.
We have a trend to stabilize above the 100 moving average once again.
We have a downtrend on the RSI indicator that supports the upward move with a breakout.
We have a support area at the lower boundary of the channel at 0.7600.
Entry price: 0.8200
First target: 0.8200
Second target: 0.8446
Third target: 0.8800
ONDOUSDT – Approaching a Breakout?( BINANCE:ONDOUSDT.P ) has been consolidating within a descending triangle on the 1D timeframe, with price testing the $0.81 support zone multiple times. The declining volume suggests a potential breakout soon, with key levels to watch:
📉 Support: $0.81 – If this level fails, we may see further downside.
📈 Resistance: $0.90 & Trendline Break – A breakout above the descending trendline could trigger a strong bullish move.
🔥 Potential Trade Idea:
• Bullish Scenario: Breakout above the trendline with strong volume → Target $0.8 - $1.00+
• Bearish Scenario: Breakdown below $0.81 → Target $0.70 or lower
💡keep an eye on volume shifts and price action confirmations.
🚨 Risk Management: Always use stop-loss and proper risk-to-reward ratios.
This is not financial advice—trade responsibly and manage your risk effectively.
Will ONDO break out soon, or will bears take control? Let me know your thoughts in the comments!

ONDO looks bullish (1D)ONDO appears to be in wave D of a larger pattern (possibly a triangle).
Wave D seems to be a diametric or symmetrical structure. This diametric may complete in the green zone, leading to an upward reversal.
We are looking for buy/long positions in the green zone. Targets are marked on the chart.
A daily candle closing below the invalidation level will invalidate this analysis
For risk management, please don't forget stop loss and capital management
When we reach the first target, save some profit and then change the stop to entry
Comment if you have any questions
Thank You

ONDO Flag and Pole Pattern 1 Week TimeframeWell, the Flag and Pole pattern is seen at a 1-week timeframe. Pirce may shift itself upwards.
Expecting a 3-month hold period.

ONDO FULL READY FOR MOONONDO is in perfect situation for moon shot. Bullish FVG tapped and also breakout done.

$ONDO Time to show the cardsI found the $ODNO pretty early on.
I knew right away it was a gem.
Now it's a leader in the RWA industry and although the industry is moving fast. We are still too young and the biggest thing is yet to come.
If I tell you now that ONDO will make x7 more from this price you will think I'm crazy, so I won't say it:).
If you're seeing this, share & pass the alpha about Ondo to someone else.
It's time we put the King of RWAs on the map👑
Setting the stage for ONDO Tokenization
Tokenized RWA's by Leaders in RWA
Investors
WEB2 TradFI WEB3 DEFI
The answer to RWA is in front of you
Ondo Team
Thank you Kyren
Best regards, EXCAVO

ONDO at Critical Levels – Breakout or Rejection?
ONDO is showing mixed signals across multiple timeframes, making this a key decision point for the next move.
ONDO 3D Update:
- Bouncing from ascending channel support, indicating strength at lower levels.
- A strong rebound here could trigger further upside momentum.
ONDO 1D Update:
- Trading inside a descending parallel channel – a breakout is needed for bullish confirmation.
- Until then, price action remains constrained within the channel.
A rally toward the channel’s upper resistance is in play—watch for a breakout signal! 🚀
ONDOUSDT: Accumulate here, bouncing on support!!Join our community and start your crypto journey today for:
In-depth market analysis
Accurate trade setups
Early access to trending altcoins
Life-changing profit potential
Ondo Finance is popular for bridging traditional finance with DeFi by tokenizing real-world assets. It targets institutional investors with compliant, secure, and liquid on-chain products. Ondo Global Markets offers tokenized U.S. securities, expanding access. The upcoming Ondo Chain, a Layer 1 blockchain, aims to support institutional-grade on-chain financial markets. This blend of TradFi and DeFi innovation drives significant interest in Ondo.
Let's analyze ONDOUSDT technically.
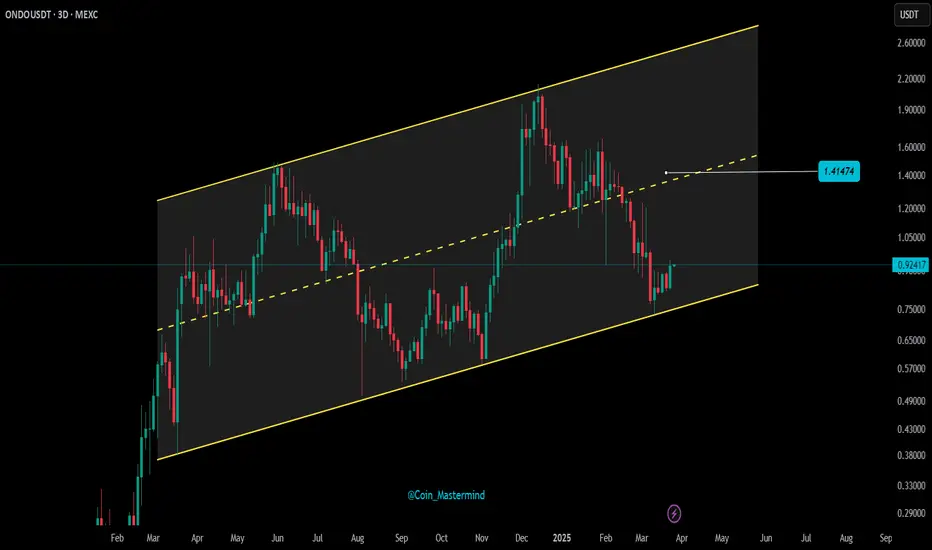
ONDOUSDT's historical trend shows bullish strength, consistently rebounding from trendline support. Now, it's bouncing off an upper support, forming higher highs and lows, confirming its uptrend. Despite a 65% drop from its peak, ONDO's strong fundamentals make it a prime accumulation target during this dip. This pattern suggests the potential for significant upward movement.
Key Levels:
Support:
$0.76 to $0.82
$0.56 to $0.60
Resistance:
$0.92
$1.47
If you find this analysis helpful, please hit the like button to support my content! Share your thoughts in the comments and feel free to request any specific chart analysis you’d like to see.
Happy Trading!!

$ONDO to $1ONDO | 12h
ONDO is consolidating above $0.80 after deviating from $0.73
If we can break through the $0.88 resistance, we could see it trading back into the breakaway gap area $1.00 and $1.07
If the momentum sustains, the next target would be $1.20

$ONDOUSDT Bull flag breakout? ONDO’s bull flag formation suggests a potential 160%+ price surge upon breakout. With strong technical and fundamental backing, the token is poised for a major move if market conditions remain favorable.

ONDO finance price analysis Today we're talking about #ONDO, which we took into copytrading according to our preliminary analysis, although the price has been pushed lower than we would like over the past 1.5 months.
Now the critical zone for OKX:ONDOUSDT is $1.10 - $1.20
Fixing above this zone can give a quick rise to $1.50 and medium-term to $2.70
👀 By the way, #ONDOfinance is made in the USA, is in the Trump Foundation's portfolio and is directly related to #Ethereum
Is this 🆒 promising or a red flag 🚩 ?)

ONDO ANALYSIS 🔮 #ONDO Analysis 💰💰
🌟🚀In 1hr chart we can see a formation "Rising Wedge Pattern in #ONDO. There is a strong resistance zone near at $0.8840 and we could see a rejection from that level but if the price breaks the resistance zone then we would see a bullish move 💲💲
🔖 Current Price: $0.8640
⏳ Target Price: $0.9350
⁉️ What to do?
- We have marked some crucial levels in the chart. We can trade according to the chart and make some profits in #ONDO. 🚀💸
#ONDO #Cryptocurrency #DYOR #PotentialBreakout

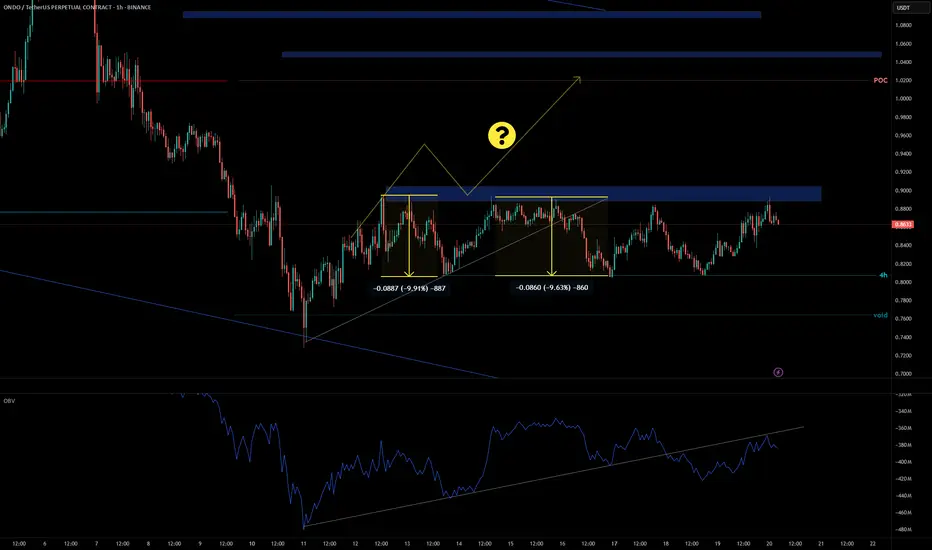
ONDO - Signal/TA Played Out Beautifully TA was given days ago and it gave us 2x almost 10 % 👌 🎯
Now: A pull back to void-Line is very possible.
OBV 1H and 2H some differences. We wait and watch which OBV Timeframe plays out.
Big Money CVD is decreasing but small retailors are going long !
OI and CVD Divergence.
It means : red situation!
TA/Signal was given here:
Follow for more ideas/Signals. 💲
Look at my other ideas 😉
Just donate some of your profit to Animal rights and rescue or other charity :)✌️
Trading opportunity for Ondo ONDOUSDTBased on technical factors there is a Buy position in :
📊 ONDOUSDT
🔵 Buy Now
🪫Stop loss 0.7250
🔋Target 1.1500
📏 R/R 1,7
💸RISK : 1%
We hope it is profitable for you ❤️
Please support our activity with your likes👍 and comments📝
