Tradecitypro | Ondo: Key Levels to Watch for Trend Reversal 👋 Welcome to TradeCity Pro!
In this analysis, I’ll be reviewing Ondo, one of the RWA projects, currently ranked 32nd on CoinMarketCap with a market cap of $3.04 billion.
📅 Daily Timeframe
As seen in the daily timeframe, a downtrend has formed, extending down to the $0.7845 low. Currently, with declining volume, the price has entered a consolidation and corrective phase.
💥 If the price manages to stabilize below $0.7845, the next bearish leg could begin. Therefore, upon breaking this level and confirming a trigger in lower timeframes, we can enter a position.
✨ In case of an upward correction, the first resistance zone will be at $0.9429, and if the price corrects further, breaking $1.1919 could confirm a trend reversal.
🛒 For spot buying, the risky trigger is $1.1919, while the main triggers are $1.6073 and $2.0434. If you have already purchased this coin, you can set your stop loss at $0.7845 in case of a breakdown. The RSI entering the oversold zone could serve as a momentum confirmation.
⌛️ 4-Hour Timeframe
In the 4-hour timeframe, a range box has formed between the $0.7845 and $0.8875 levels.
✔️ Buyers have shown stronger volume and momentum within this range. If $0.8875 is broken, you can enter a long position.
🔽 For a short position, if $0.7845—a significant level on the daily timeframe as well—breaks, you can enter. As mentioned earlier, breaking this level could trigger the next bearish leg.
📝 Final Thoughts
This analysis reflects our opinions and is not financial advice.
Share your thoughts in the comments, and don’t forget to share this analysis with your friends! ❤️
ONDOUSDT trade ideas

$ONDO LONG?As we can see, price already bounce back down from golden zone on Fibonacci. Maybe we can put Long order on Order block, or bullish engulfing candles as our entry, SL+ if you got the profit.
#DYOR

Bullish Divergence Spotted! Is ONDO Ready to Pump?The price of ONDO/USDT is currently trading within a broader sideways range, respecting both the upper resistance and lower support levels. The falling resistance trendline has been acting as a strong barrier, rejecting the price multiple times.
However, a bullish RSI divergence is forming at the lower support zone, signaling a potential reversal or bounce.
If the price holds above the support, a breakout above the trendline could trigger an upward move towards the upper resistance zone. On the downside, losing support could lead to further weakness.

LONG ONDUSD - BUY Long ONDOUSD - price might tend to go down a bit more before going up.
Buy between $0.50 - $0.70 range.
At Ondo, we design institutional-grade platforms, assets, and infrastructure to bring financial markets onchain. This is what MEXC:WHITEUSDT is trying to be or mimic.
This can easily be a $50-100 Token in 3-5 years. Plus its safer then $WHITE.

ONDO | ALTS | Lower Price LikelyONDO could be a good hold, if a lower entry presents itself.
It's worrisome that the opening prices have not yet been retested, and the next immediate support zone is approaching fast:
I'd be willing to start accumulating from anywhere under the next immediate support zone.
____________________________
BYBIT:ONDOUSDT

ONDO - Some new local Levels for Trade!there are some interesting levels (maybe for scalpers).
Can we see a small move upward?
Small short on upper levels could be plausible.
But the Chart is not that clear. A new TA must be done on upper levels, if it reaches there.
Follow for more ideas/Signals. 💲
Look at my other ideas 😉
Just donate some of your profit to Animal rights and rescue or other charity :)✌️

#ONDO/USDT#ONDO
The price is moving in a descending channel on the 1-hour frame and is adhering to it well and is heading to break it strongly upwards and retest it
We have a rebound from the lower limit of the descending channel, this support is at a price of 0.7550
We have a downtrend on the RSI indicator that is about to be broken and retested, which supports the rise
We have a trend to stabilize above the moving average 100
Entry price 0.8180
First target 0.8890
Second target 0.9588
Third target 1.034

#ONDO/USDT #ONDO
The price is moving in a descending channel on the 1-hour frame and sticking to it well
We have a bounce from the lower limit of the descending channel, this support is at a price of 1.25
We have a downtrend on the RSI indicator that is about to be broken, which supports the rise
We have a trend to stabilize above the moving average 100
Entry price 1.42
First target 1.51
Second target 1.64
Third target 1.76

ONDO I Blackrock Coin arrived to the Order block. Long !ONDO coin is the native token of the Ondo Finance platform, a decentralized finance (DeFi) project.
Ondo Finance focuses on creating structured yield products and risk-managed crypto investments. The ONDO token typically plays roles in governance, incentivizing community participation, and may provide benefits within the platform’s ecosystem.
There are rumours about BlackRock's plans to use this coin for the future digitalized investments.
Hey Traders!!
Feel free to share your thoughts, charts, and questions in the comments below—I'm about fostering constructive, positive discussions!
🧩 What is CLS?
CLS represents the "smart money" across all markets. It brings together the capital from the largest investment and central banks, boasting a daily volume of over 6.5 trillion.
✅By understanding how CLS operates—its specific modes and timings—you gain a powerful edge with more precise entries and well-defined targets.
🛡️Follow me and take a closer look at Models 1 and 2.
These models are key to unlocking the market's potential and can guide you toward smarter trading decisions.
📍Remember, no strategy offers a 100%-win rate—trading is a journey of constant learning and improvement. While our approaches often yield strong profits, occasional setbacks are part of the process. Embrace every experience as an opportunity to refine your skills and grow.
Wishing you continued success on your trading journey. May this educational post inspire you to become an even better trader!
“Adapt what is useful, reject what is useless, and add what is specifically your own.”
Dave Hunter ⚔

ONDObeen looking at this for a while... a strong and must to be added on spot portfolio
structures across most of alts are invalidated... BTC and ETH are taking their key levels and we are in the final stage of capitulation
will reupdate all the charts (I'm holding) after the dust settles
Bull Run isn't over... wait for consolidation and we can have our alts rally in a few weeks

$ONDO/USDT Accumulation Analysis
🔸 Key Support Zone at 0.55 - 0.83:
ONDO is currently in a potential accumulation phase within the highlighted support zone. Price has tested this area multiple times, indicating strong demand.
🔸 Upside Target: $1.50 - $2.00
Once the accumulation phase is completed and ONDO breaks above the $1.00 resistance, it can potentially rally towards $1.50 and beyond.
🔸 Risk Level at $0.50:
A clean breakdown below $0.50 would invalidate the bullish outlook and signal further downside risk.
🔸 Action Plan:
Start accumulating ONDO in the $0.83 - $0.55 range.
Use a Dollar-Cost Averaging (DCA) strategy to manage risk.
Wait for a breakout above $1.00 for confirmation of trend reversal.
If price drops below $0.50, reassess the position.
This is a high-reward potential setup, but patience is key while accumulation plays out.

ONDOUSDT 1DONDO ~ 1D Analysis
#ONDO Buy gradually in this support block. with a short -term target of at least 15%+.

ONDO Testing its trendlineONDO is testing it trend line that goes way back to when coin launched.
Also testing very strong supply area.
If Close above 1.01 level it will be very bullish. Looking forward.

Breaking: $ONDO Tanks 13% Today- What Next? Standing as a beacon in the realm of decentralized finance Ondo (ONDO) aiming to democratize access to institutional-grade financial services. Founded in 2022 and based in the Cayman Islands, Ondo operates through a unique ecosystem that bridges traditional finance with blockchain technology. The Ondo Foundation collaborates closely with Ondo Finance, its commercial partner, to support decentralized protocols and the tokenization of real-world assets.
Earlier today, the native token CRYPTOCAP:ONDO tanked 13% placing the coin on the cusp of a selling spree. However, CRYPTOCAP:ONDO faded a breakdown in the $0.866 pivot- a pivot that turned out to be the support point. If Selling pressure should increase, a break below the $0.866 point for CRYPTOCAP:ONDO would pose a serious threat for CRYPTOCAP:ONDO as the RSI is already weak at 41.82.
As indicated by the chart, a break above the $1.27 pivot could send CRYPTOCAP:ONDO on a bullish voyage with a breakout above the 1-month high as confirmation.
Ondo Price Live Data
The live Ondo price today is $0.973556 USD with a 24-hour trading volume of $462,035,194 USD. Ondo is down 13.67% in the last 24 hours, with a live market cap of $3,075,569,399 USD. It has a circulating supply of 3,159,107,529 ONDO coins and the max. supply is not available.

BlackRock and ONDO Pioneer Real World AssetsBlackRock has initiated strategic expansion into the Real World Assets (RWA) sector, with preliminary allocations to its BUIDL fund signaling active preparation for tokenization initiatives. Supporting evidence includes documented transactions, which underscore early-stage operational readiness for asset digitization. A detailed analysis of these deals can be found below.
Concurrently, the upcoming crypto summit, featuring participation from a White House representative of ONDO, highlights growing institutional and governmental engagement with digital asset frameworks. This development suggests alignment between public-sector policy and private-sector innovation, reinforcing the potential for regulatory advancements in tokenization.
Such coordinated activity underscores a broader trend toward integrating blockchain-enabled solutions into traditional financial infrastructure, with industry leaders and policymakers collaboratively exploring scalable applications of decentralized technologies.
Alex Kostenich,
Horban Brothers.

ONDOUSDT 1DONDO ~ 1D Analysis
#ONDON Buy after successfully penetrating this resistant line with a short -term target of at least 15%+.
ONDO DAILY TIMEFRAME UPDATE (ON DEMAND) ❤️ THIS POST AND I WILL SHARE NEXT pair
ONDO token holders are entrusted with shaping the future of the Ondo DAO so that it continues to pursue its mission to democratize access to institutional-grade finance. The Ondo DAO gives ONDO holders specific rights pertaining to Flux Finance, which is currently governed by the Ondo DAO
ANY THOUGHTS ON LSE:ONDO ?

ONDO FINANCE (EXPERIMENTAL)Institutional-Grade Finance, Now Onchain.
LSE:ONDO is building the next generation of financial infrastructure to improve market efficiency, transparency, and accessibility.

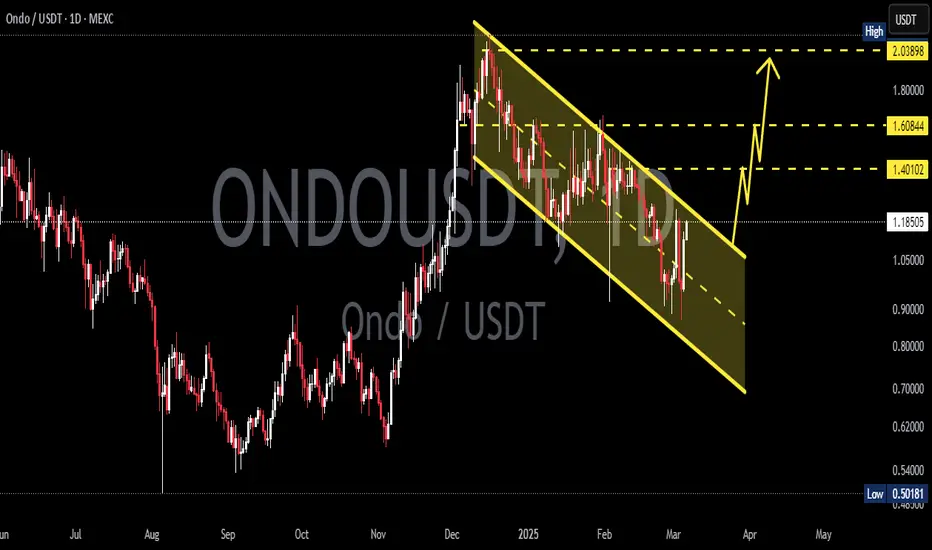
$ONDO/USDT Trading IdeaONDO printed the same pattern after a 60% drawdown. Now send it higher! Let’s retest the top of this descending channel. My next target is $1.20. Then, after a clean breakout, let’s explore new ath territories.

ONDO : one of the RWA crypto projects | Univers Of SignalsLet's take a quick look at ONDO, one of the RWA crypto projects, which ranks 32nd on CoinMarketCap with a market cap of $3.08 billion.
✨ In the 4-hour timeframe, we see a parabolic downtrend that started from the $1.4340 peak. In the first leg, the price reached the $1.0972 support. In the next leg, after breaking $1.0972, it dropped to $0.9255. After numerous red candles with high volume, the price has now entered a correction phase, forming a few green candles.
💫 The RSI oscillator is currently pulling back to the 30 zone, and if it gets rejected from this level, we might see the next bearish wave. However, if it moves back above the 30 zone, the price could form a new ranging box.
📊 If the $0.9255 zone is broken, you can open a short position. For a long position, wait for the price to form a new structure to create a long trigger.

ONDO/USDT Technically & Fundamentally is Bullish🚀 Trade Setup Details:
🕯 #ONDO/USDT 🔼 Buy | Long 🔼
⌛️ TimeFrame: 1D
--------------------
🛡 Risk Management:
🛡 If Your Account Balance: $1000
🛡 If Your Loss-Limit: 1%
🛡 Then Your Signal Margin: $19.19
--------------------
☄️ En1: 1.36344 (Amount: $2.88)
☄️ En2: 1.17869 (Amount: $6.72)
☄️ En3: 1.04718 (Amount: $8.64)
☄️ En4: 0.91566 (Amount: $1.92)
--------------------
☄️ If All Entries Are Activated, Then:
☄️ Average.En: 1.17986 ($19.19)
--------------------
☑️ TP1: 2.14627 (+81.91%) (RR:1.57)
☑️ TP2: 2.48132 (+110.31%) (RR:2.12)
☑️ TP3: 2.90718 (+146.4%) (RR:2.81)
☑️ TP4: 3.4489 (+192.31%) (RR:3.69)
☑️ TP5: 4.04698 (+243.01%) (RR:4.66)
☑️ TP6: Open 🔝
--------------------
❌ SL: 0.56495 (-49%) (-$10)
--------------------
💯 Maximum.Lev: 1X
⌛️ Trading Type: Swing Trading
‼️ Signal Risk: Low-Risk!
🔎 Technical Analysis Breakdown:
This technical analysis is based on price action, SMC (Smart Money Concepts), and ICT (Inner Circle Trader) concepts. All entry points, Target Points, and Stop Loss are calculated based on professional mathematics formulas as a result you can have an optimal trade setup based on great risk management.
📊 Sentiment & Market Context:
The ONDO/USDT pair is currently showing strong bullish potential, with price action indicating an upward trend. Market sentiment remains positive, fueled by growing interest in decentralized finance (DeFi) and ONDO's increasing utility within this space. The coin is well-positioned to take advantage of the broader crypto market recovery, with key support levels holding strong. Technically, ONDO is setting up for a breakout above resistance, signaling further upward momentum. With solid fundamentals, including active development and expanding partnerships, ONDO's market outlook looks favorable in the coming days. Keep an eye on the key levels for confirmation of the bullish trend!
⚠️ Disclaimer:
Trading involves significant risk, and past performance does not guarantee future results. This analysis is for informational purposes only and should not be considered financial advice. Always conduct your research and trade responsibly.
💡 Stay Updated:
Like this technical analysis? Follow me for more in-depth insights, technical setups, and market updates. Let's trade smarter together!

$ONDO - Scalp Long IdeaLSE:ONDO | 4h
We took out the down-wick
Now, I'm looking for this possible play, targeting $1.12 as initial target
Stoploss just below the recent low
Targets:
$1.12
$1.24
$1.30

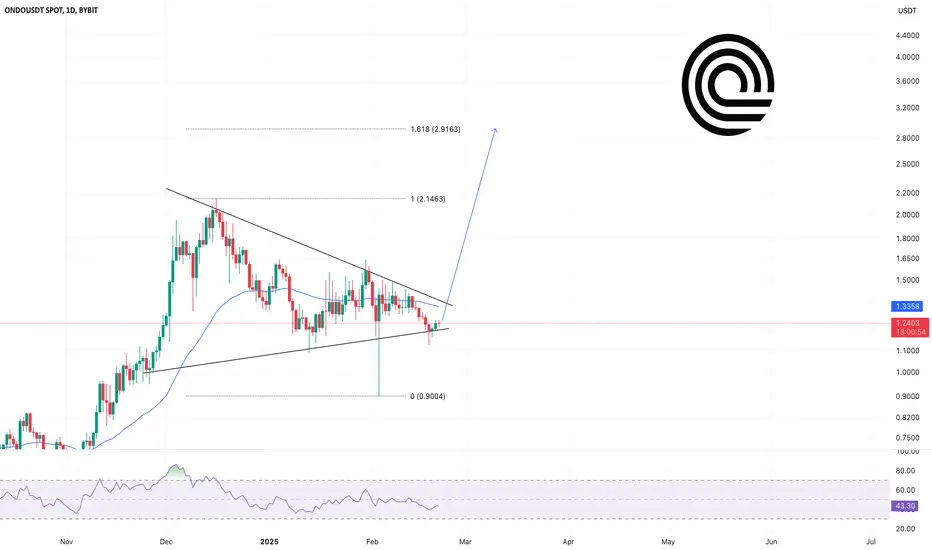
ONDO is the brainchild of BlackRockONDO is the top-1 tokenization platform for Real World Assets. I have already spoken at May 2024 where I talked about the relevance of the RWA sector and its aspirations for widespread adoption in blockchain. Specifically ONDO is a very progressive project that is launching its ONDO Chain! I think we will see strong upside in the asset over the near term and approach the 1.618 Fibonacci level. More globally, I would expect much higher values.
Horban Brothers.