Long ONE Long has bounced from the monthly support.
On 4H TF, it's just broken the trendline resistance.
Long setup is as in chart.
Disclaimer:
This analysis is based on my personnal views and is not a financial advice. Risk is under your control.

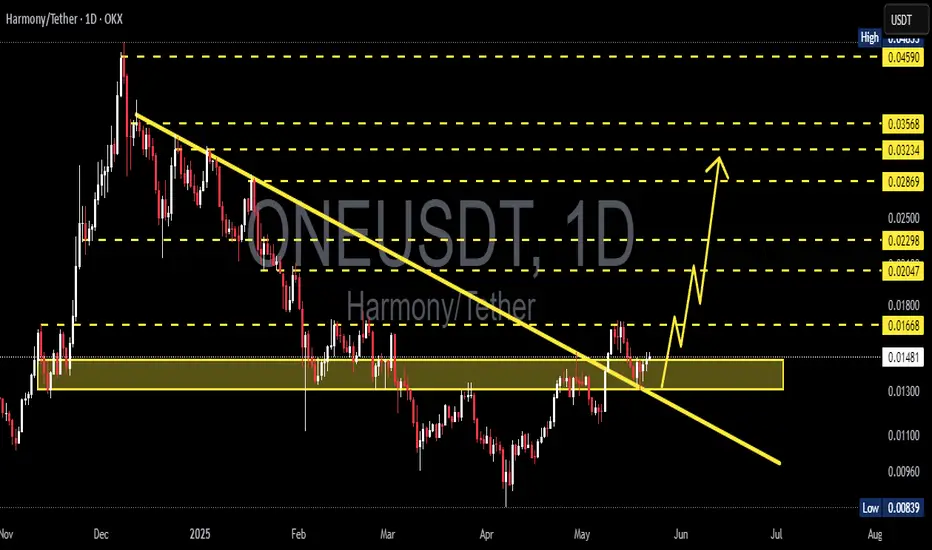
ONEUSDT 1D#ONE has broken above the descending resistance and the SMA100 on the daily chart. It is now facing resistance from the Ichimoku cloud. In case of a breakout above it, the targets are:
🎯 $0.01303
🎯 $0.01455
🎯 $0.01609
🎯 $0.01828
🎯 $0.02107
⚠️ As always, use a tight stop-loss and apply proper risk

ONEUSDT at Make-or-Break Zone Major Reversal or Breakdown Ahead?📌 Overview:
ONEUSDT is currently sitting at a major historical support zone around $0.0080–$0.0093 (highlighted in yellow).
📉 This level has been tested multiple times since 2022, and continues to hold – signaling strong accumulation and potential for a major reversal.
🧠 Key Pattern in Focus:
✅ T

ONE/USDT – Adam & Eve Reversal Setup✅ Adam & Eve bottom formation confirmed with breakout.
✅ Major trendline breakout supported by strong bullish momentum.
✅ Neckline retest currently in progress — key support for continuation.
🎯 Targets: TP1: $0.0163
TP2: $0.0182
TP3: $0.0200
📌 Key Levels:
10

ONEUSDT 5D AnalysisONE ~ 5D Analysis
#ONE Buy back gradually from here if you still have confidence in this coin with a short term target of at least 20%+ from this support.

oneusdtoneusdt might have completed accumulation and we might come to lows more one time before blast .it usually comes for test and then makes higher high and higher lows .

#ONE/USDT#ONE
The price is moving within a descending channel on the 1-hour frame and is expected to break and continue upward.
We have a trend to stabilize above the 100 moving average once again.
We have a downtrend on the RSI indicator that supports the upward move with a breakout.
We have a support a

ONE – Key Structure Alignment Across Timeframes🔍 On the 1H chart, ONE is moving within a broadening channel — several rejections are keeping price contained for now 🌀
⏱ On the 4H timeframe, a symmetrical triangle is tightening up — indicating a possible volatility expansion soon 🔺
📈 On the higher timeframe, price is attempting to re-enter a la

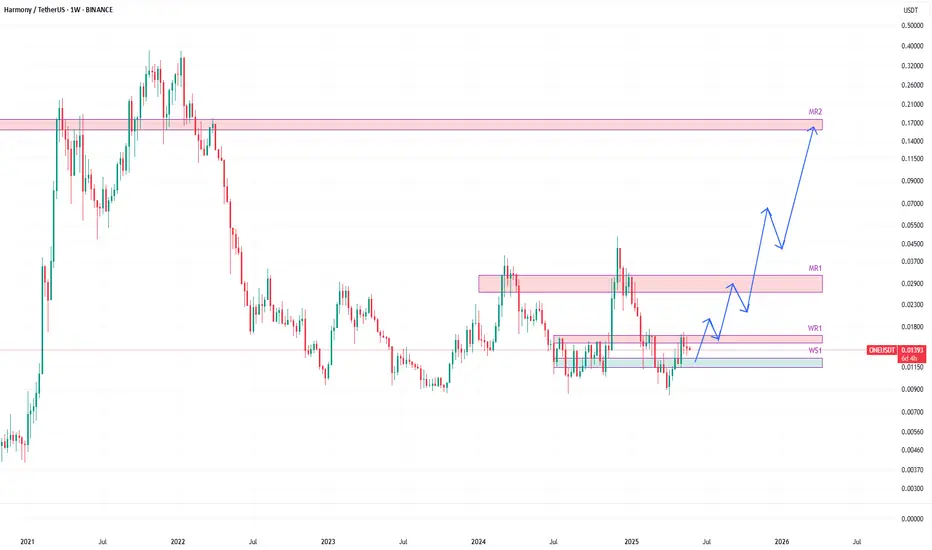
ONEUSDT likely to head towards 0.16 zoneONEUSDT is another one trading between weekly resistance WR1 and weekly support WS1.
The price has been retracing back to WS1 after hitting WR1. It is likely to hit WS1 before having a bounce.
WS1 is likely to provide a good bounce and the fuel for its upward journey in coming weeks and months.
T
ONEUSDT 1D AnalysisONE ~ 1D Analysis
#ONE Buy gradually from here with a short-term target of at least 10%++ from here.
See all ideas
Summarizing what the indicators are suggesting.
Oscillators
Neutral
SellBuy
Strong sellStrong buy
Strong sellSellNeutralBuyStrong buy
Oscillators
Neutral
SellBuy
Strong sellStrong buy
Strong sellSellNeutralBuyStrong buy
Summary
Neutral
SellBuy
Strong sellStrong buy
Strong sellSellNeutralBuyStrong buy
Summary
Neutral
SellBuy
Strong sellStrong buy
Strong sellSellNeutralBuyStrong buy
Summary
Neutral
SellBuy
Strong sellStrong buy
Strong sellSellNeutralBuyStrong buy
Moving Averages
Neutral
SellBuy
Strong sellStrong buy
Strong sellSellNeutralBuyStrong buy
Moving Averages
Neutral
SellBuy
Strong sellStrong buy
Strong sellSellNeutralBuyStrong buy
Displays a symbol's price movements over previous years to identify recurring trends.