ONEUSDT trade ideas


Time to Buy ONEUSDT 💎4H Time Frame .
Buy One Here and hold it to midline !
We have Double Support here ..
its ready to move up !

ONE/USDT ChartHi, I try to post often so if you could follow and like it would mean a lot to me.
BTC made a strong move today so I expect some alts to slowly catchup. ONE is looking really good and I expect a retest to the 0.31$ resistance. The coin had a rejection at the 0.28$ support and I expect a strong movement in the next days.
Crypto market is really risky right now with BTC slowbleeding, and getting outperformed by many altcoins ( ETH being one example) and thats never a good market sign. Be careful with any leverage trade because this is not the time to risk it all. Not financial advice.
I will stream tomorrow on TradingView so come to the stream at 4:15 pm UK time. I will do a review on all altcoins and answer all your questions.

Falling Wedge reversal ideaPossible the PA falls back down to the rectangular area where there has been support bounces in the past.

$ONE$ONE :
Have a look at this $ONE.
Looks pretty well poised.
Possible scenarios - IMO :
1. It might pump a bit(Minor Resistance Zone)., to retrace back to Buy zone to gain volumes.
Once the Major resistance is broken - ATH incoming.
2. It might close Between Minor resistance and Buy zone., Oscillates for some days/Weeks (Confirming Bearish)
further drops down to True Buy Zone and Skyrockets to ATH.
$ONE is not the only one looking hazy.
Isn't it ?
Happy Trading.,

#Harmony #ONEUSDTweekly time-frame:
end of wave 5 with divergence confirmation.
daily time-frame:
A 3drive compression pattern shaped and confirmed with the trigger line break down closed candle.


One Bullish idea$ONE is really close to a strong support level and has formed a falling wedge
like I said in my previous analysis I think we bottomed

ONEUSDT, ongoing reversal?There's a divergence on the chart. Minute, but it's there. Probably a reversal is going to be happen.
All my entry, stop loss and profit target are in the chart.
Your money, your responsibility.

ONEUSDT Daily S/R | .618 Fibonacci| Price Action| Trend Evening Traders,
Today’s analysis – NEUSDT – trading towards a technical trade location where a bounce is probable,
Points to consider,
- Price action corrective
- Daily S/R Support
- Swing High Objective
- Low Volume
- Trend
ONEUSDT’s immediate price action is trading towards a trade location that has technical confluence with the .618 Fibonacci and Two Daily S/R Supports, allowing for a bullish bias.
The swing high is the immediate objective, exceeding this level will lead to a trend continuation.
The current volume profile is below average, an influx is highly imminent before the next expansion.
Overall, in my opinion, ONEUSDT is a valid long with defined risk, price action is to be used upon discretion/ management.
Hope this analysis helps,
Thank you for following my work
And remember,
“The market can stay irrational longer than you can stay solvent.” – John Maynard Keynes


ONE (Retracement)ONE retesting support on fib 0.618, i don't think it's gonna hold. Deeper retracement towards 0.26 seems possible. Slightly above the 200 MA on the 8H timeframe.
ONE 8H

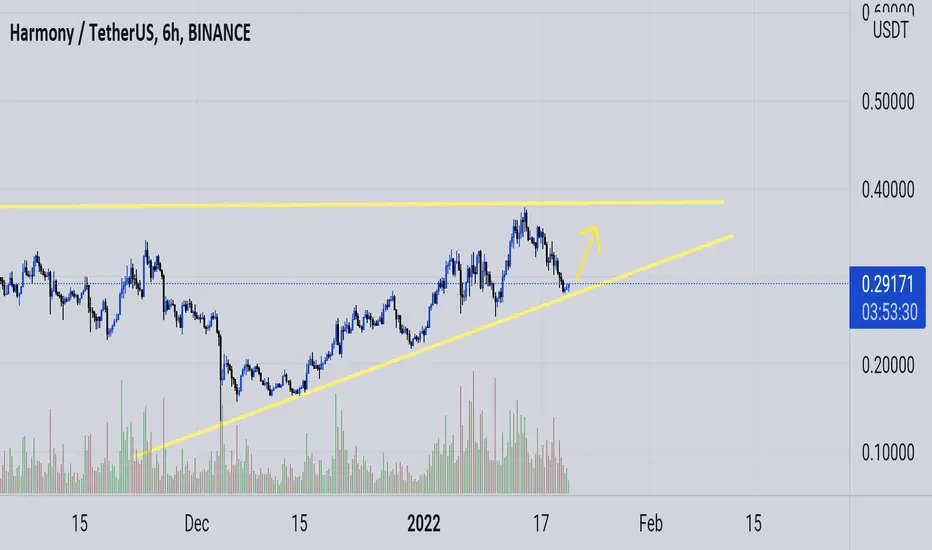
up trend channel and double botttomone/usdt shows up trend channel
higher highs and higher lowes
i think its testing the bottom line of the channel to start going up
entry 0.297
first target 0.36
second target 0.42
stop loss 0.2669

ONE, double top pattern.The following content is machine translation:
The former high was blocked and fell back, forming a double top.
The short-term downtrend has become.
The indicator macd is about to die.
Operate on the layout of empty orders near 0.33, and see the support near 0.26 or 0.225 below.

ONE USDT DAILY/HOURLYNOT FINANCIAL ADVICE !
This is technical idea about one / usdt coin (harmony)
focus on green side but there is idea of dumping bitcoin then the down shown arrow will pop up.

HARMONY (ONEUSDT) Ready for another 400% move 🚀ONEUSDT is getting ready for another 400%.
All price and indicators breaking all time highs.
Good entry here.
Follow me so you can get early exit signal.
Remember to like, share and follow for more timely analysis.

Long $ONE?Seeing a decent probability in ONE moving to the upside here. It looks like a decent bet across a few timeframes. The green box shows opportunities to enter or DCA. Planning on taking profits when it reaches the median of the regression channel.

ONEUSDT - Elliot Wave Analysis- the big picture still looks pretty good to the upside, however; we do expect a minor retracement to around 0.277 soon.
- this is because according to elliot wave theory, a 61.8% retracement will follow a non-standard correction (abxcabc).

OneUsdtWill Harmony One hit the All Time High? According to my simple trendlines analysis it may happen but what you need is passion.
Tipp for all who are new in this space: even if the analysises are very correct and accurate but the price of an altcion also depends on the Bitcoin. If it drops most likely the whole altcoin market is going to follow it. So I think this coin has potential to go up but u still have to look at the chart of Bitcoin!
Thanks.

