ONEUSDT trade ideas

HARMONY AMAZING CHART VIEW !!!Harmony (ONE) is absolutely one of the best options for holding.
Entry must be around 0.3426
Fail limit: daily candle closed under the 0.20

ONE pump???Risk warning, disclaimer: the above is a personal market judgment based on published information and historical chart data on Tradingview, all analysis is only subjective. Hope investors consider, I am not responsible for your investment decision. Thank you.
Good luck.

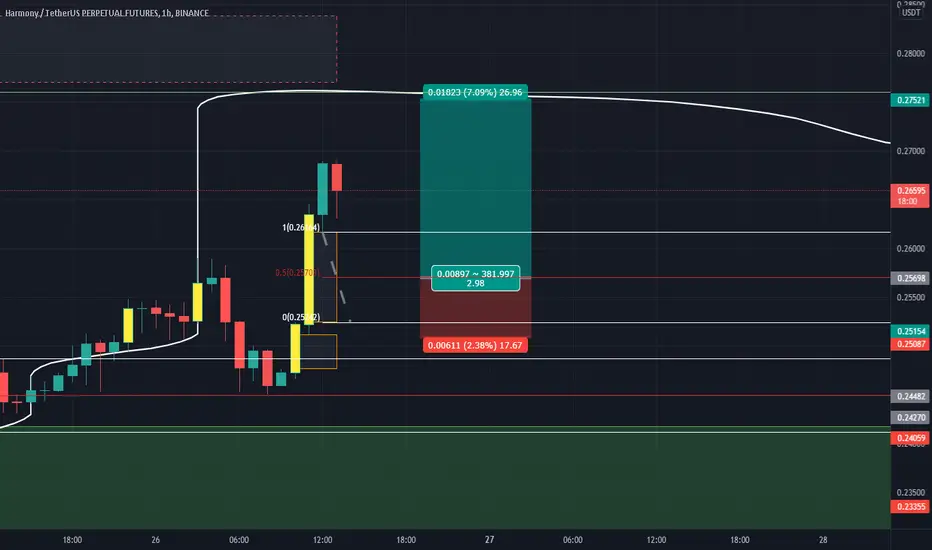
$ONE FIB support/resistance One has been trending this is a quick TA I am currently long $ONE from .24 first price target .28
bullish/neutral above 0.25700 $USDT
bearish below 0.25700 $USDT


IS IT GETTİNG BETTER ONE LOVE ONE NİGHTProbable senario for Harmony...Hurry each other,,, Hurry each other..One LOve

ONEUSDT - Broadening Wedge PatternONEUSDT (1D Chart) Technical analysis
ONEUSDT (1D Chart) Currently trading at $0.264
Buy level: Above 0.273 (BUY AFTER BREAKOUT)
Stop loss: Below $0.210
TP1: $0.318
TP2: $0.369
TP3: $0.417
TP4: $0.472
Max Leverage 3x
Always keep Stop loss
Follow Our Tradingview Account for More Technical Analysis Updates, | Like, Share and Comment Your thoughts.

Harmoney Daily TA : 01.01.22 : $ONEAll supports and resistances are marked on the chart. As we can see, the price is in an important range and recommended to keep an eye on it ...
Follow our other analysis & Feel free to ask any questions you have, we are here to help.
⚠️ This Analysis will be updated ...
👤 Arman Shaban : @ArmanShabanTrading
📅 01 . 01 .2022
⚠️(DYOR)
❤️ If you apperciate my work , Please like and comment , It Keeps me motivated to do better ❤️

Harmony one bullish scenarioOne is currently bounce form support band that stands .65 level of Fibonacci
it seems bullish as breaking 0.382 level of Fibonacci and towards first major resistance (Red line) 0.26 value which is also 0.236 of Fibonacci level

ONE HARMONY USDTI am sharing $ONE/USDT's support, Resistance, and possible long-term targets.
As you can see price is maintaining its upside movement in an upside Parallel channel on a daily and weekly timeframe .
Plus there is a symmetrical triangle on the price chart on 4hr and daily timeframe which is bullish and if I measure the size and see the possible target is the same as Fib golden ratio of 1.618.
Even the RSI on 4hr timeframe taking support on upward trendline
NOTE: #DYOR

OneusdtHi friends harmony stays well on dynamic support line ,and rejected on .5 fib nicely 👌 now we wait for break out of descending dynamic line ,if break out happen we can enter or wait for retesting the line after
Tps Ath


#ONEUSDT #Harmony #BinanceSmartChainIt is in a very sensitive range, which is indicated by a yellow line on the chart. If this range is broken, it will probably reduce the price to the range of 0.152 to 0.142.
Current resistance:
0.273 to 0.283

ONEONE contines to move to the upside, broke the a major resistance level. Trade is running around 16%, you can take some profits now and hodl the trade with BE stops. 4H candle closed above the resistance, if daily candle also give a close above resistance then we can see some aggresive pump in #ONE.

ONEUSDTBe ready for a huge profit if a candle closes above 0.26900 then you should go for a long of 0.35 so be carefull

ONE double top on the weekly resistanceI was hoping ONE would break the weekly breaker candle resistance at 0.266$, but unfortunately it reversed down from there after testing it twice on the 4h time frame, the monthly time frame still looks very bullish.


ONEONE again dips back to the support zone exactly and bounced. Trade running in tiny bit of profits, so manage the trade properly. There's a symmetrical traingle pattern forming, which can breakout soon as soon as #BTC will broke the resistance. Those who bought at the support can hodl with tight stops.


#ONE needs to break out its resistance #ONE in it's #USDT pair broke out the dynamic resistant in the area of 0.25 and needs to consolidate above this level
Targets can be 0.28 - 0.32 - 0.34
Supports : 0.23, 0.20

ONE movingBuy the breakout 0.26328, a retest would be better. Looks like ONE is on the move for higher price action.
