ONEUSDT - 1HDue to the decrease in the upward momentum of the price movement, if the range of 0.0145 units is broken and the price stabilizes below it, the price may fall to the range of 0.0142, and in the case of the strength of the range of 0.0136 units.
Otherwise, the possibility of price increase up to the range of 0.0153 units.
ONEUSDT trade ideas

#ONE/USDT is testing the Diagonal Trendline in 4-Hour TF!#ONE/USDT is testing the Diagonal Trendline in 4-Hour TF!
LSE:ONE needs to clear trendline and PWH $0.01505 resistance level to gain the bullish momentum. Wait for BO/retest to long it.

ONE target 0.024 $ 0.051D time frame
-
ONE is consolidating under the long-term downtrend, and retesting the 0.618 Fibonacci Retracement, so here is a good timing to set up a perpetual trading plan with 3.6 RR. Also, there is a strong support on higher time frame around 0.008~0.010, this is a great zone to accumulate spot if ONE come back again in future. Therefore, I provide two trading plans for perpetual and spot.
-
Perpetual:
TP: 0.024 / 0.031
SL: 0.0119
Spot:
TP: 0.05
SL: 0.0079

ONEUSDT weekly set up projectionEnter on the 0.5 fib level or the 0.66 and the 0.616 aim to exit a the two supply zone above.
Exit the trade at the red line.

ONE going Long With Fibo Analysis Overview about the coin:
What is Harmony (ONE) Crypto?
Harmony is a high-speed, open-source, public blockchain with EVM compatibility and smart contract functionality that can offer a more efficient platform to operate Ethereum decentralized applications (dApps).
The open and fast blockchain Harmony boasts a transaction finality time of just over two seconds and transaction fees 100 times lower than Ethereum.
As of July 2022, the Harmony ecosystem enjoys a total value locked (TVL) of over $1 billion across decentralized finance (DeFi), NFT, Web3, and gaming categories. The blockchain's developers are focusing on improving its capabilities to support more Web3 dApps, adding features such as Zero Knowledge proofs to production, and decentralizing governance through funding and supporting decentralized autonomous organizations (DAOs).
ONE is the native token of Harmony, used for paying transaction fees, gas fees, and storage fees within the blockchain network. In addition, users can stake ONE on the Harmony network to become nodes and participate in the consensus mechanism by validating transactions. Validators also enjoy governance responsibilities by staking ONE within the network.
Analysis:
With a market cap of only $145M, I see a great opportunity for a further pump once any positive news is released like partnerships or fur to we collaborations to decentralize international transactions.
Let’s waits and see!!
This is not a financial advice.

ONEUSDT_N37ONEUSDT
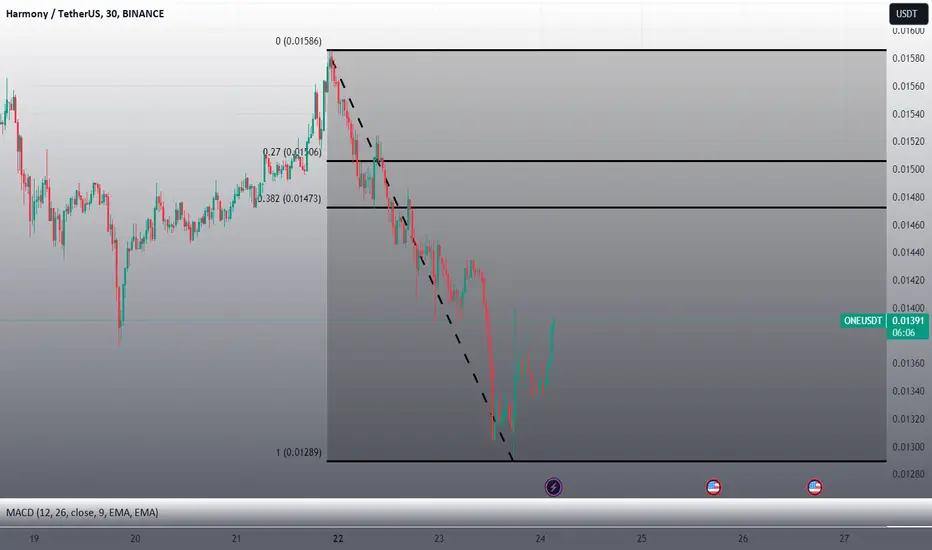
En: 0.382 and 0.27
Sl: 0 (1% of your balance)
Tp: 1
(Check the picture or tradingView for Numbers)
Cancel if Tp crossed without opening
#30Min_trade
#N37
ONE swing longI mapped this since early 2023, we are still in the zone and price seems to be bullish
I am accumulating spot and longing some futures
invalidation if price closes below EMA 50 weekly
nfa educational purpose only

Oneusdt LongLonging this from here with margin because
Expecting a massive bullish wave on this one from here, If right on idea.
Entering long at 0.01415.
Tight and Flat stoploss at 0.01380.
(Is a Risky pick but RR was too good on this one)
My spot bags are down by 12% already bought around 0.01600.
Stoploss set at 0.1350(about -17%) because more breakdown is going to hurt me more.
Note: Not a Financial Advice.

ONEUSDT_N35ONEUSDT
En: Live
Sl: 0.01587 (1% of your balance)
Tp: 0.01374
Cancel if Tp crossed without opening
#45Min_trade
#N35

ONE Bullish ONE pullback from Support zone and break up the trendline.
I am waiting when price will break up the resistance zone.

🚨 Trade Alert: ONE/USDT (3-5x)🚨 New Trade Alert 🚨
✅ ONE/USDT (3-5x)
📈 LONG Entry Zone: 0.0151 - 0.0161
⛔️ SL: 0.01447
🔒 Breakeven Move: When it moves close to TP2
🎯 Take Profit:
Short Term: 0.01626 - 0.01642 - 0.0168 - 0.0172 - 0.0182
Mid Term: 0.0192 - 0.0202 - 0.0212 - 0.0222 - 0.0232
📝 Ensure you set entry orders to balance the trade's entry and aim to secure 30% of profits within the first two targets. Once profits are gained, adjust the stop orders to match the entry points or break-even levels.
⚠️ Disclaimer: Historical earnings cannot assure future outcomes. Is there a potential for risk? Certainly. The entire financial market is susceptible to uncertainties; any underlying factor or abrupt shift in market sentiment could overturn the current market trends and lead to losses. Refrain from undertaking undue risks that might jeopardize your financial stability. You are under no obligation to engage in this trade; kindly avoid the trade if you disagree with the trade analysis.
GIS TRADING®

ONEUSDTIn my opinion, it has formed a top Head and shoulders pattern and it can descend from here to almost the support floor of 129 and start its upward movement again from there.

ONE target 0.034h time frame
-
ONE gets support from the uptrend since Oct '23, and this is a reasonable retest zone after ONE broke out the long-term downtrend on Dec '23. According Fibonacci tools, we have three targets, 0.03, 0.038 and 0.048.
-
TP: 0.03 / 0.038 / 0.048
SL: 0.01397

Harmony one looking bullishWell, we got 5 waves down. RSI lookin realy nice. Just wait for the trendline to be broken.
I think we have found a botom.

ONEUSDT ONEUSDT is trading in falling wedge pattern. The price was reacting well the support and resistance of wedge.
Currently the price is about to give breakout from falling wedge and after successful retest of the level will be bullish signal and seems like the price may go for another leg higher.
If the breakout sustain to upside the optimum target could be 0.01970 followed by 0.0214.
What you guys think of this idea?

ONEUSDT January_b5ONEUSDT
Entry : Live
Sl : 0.01178
Tp1 : 0.02315
Tp2 It's up to you
R/R ~ 2.32
#Forexologist1st
#Snownium
#January_b5

Oneusdt Might go massive Expecting crazy move from this if holds this level.
Spot Long from here.
0.01600 and around.
If holds here this might explode.
Targeting 0.12000
Yes 0.12000
Note: Not a Financial Advice.


ONE/USDT Long Bullish Scenario#ONE hit the support zone on 8H Time frame with the BTC drop, now filled completely, waiting for good bullish trend.

ONE cup and handle pattern nearly complete.ONE have been forming a cup and handle pattern for quite some time now, and is finishing up the handle. This could hand some pretty good gains to the day/swing trader's if you get the right entry.

✴️ Harmony Bottom/Consolidation Leads To Bullish WaveLast year Harmony (ONEUSDT) produced a bullish wave after a major low mixed in with a consolidation pattern.
This year we have the same situation, a consolidation pattern with a lower low that can lead to a strong bullish wave.
Last time this pair grew by more than 200%, the market was weak with plenty of bad news around, this round we can have something similar or an even bigger bullish wave. While market conditions are not great, they are much better compared to early 2023.
I hope you find this information useful.
Namaste.

$oNE #Harmony Trading IdeaLSE:ONE #Harmony falling wedge played out perfectly. Now keep your eyes on the 1W timeframe. If we break this falling wedge on the 1W timeframe the price can increase even higher. The price increased by 139.17% in total after my call.
