I think ONGUSDT will increas foward daysI think ONGUSDT will increase foward days bollinger band sequeze and chart is depent on momentum
ONGUSDT trade ideas

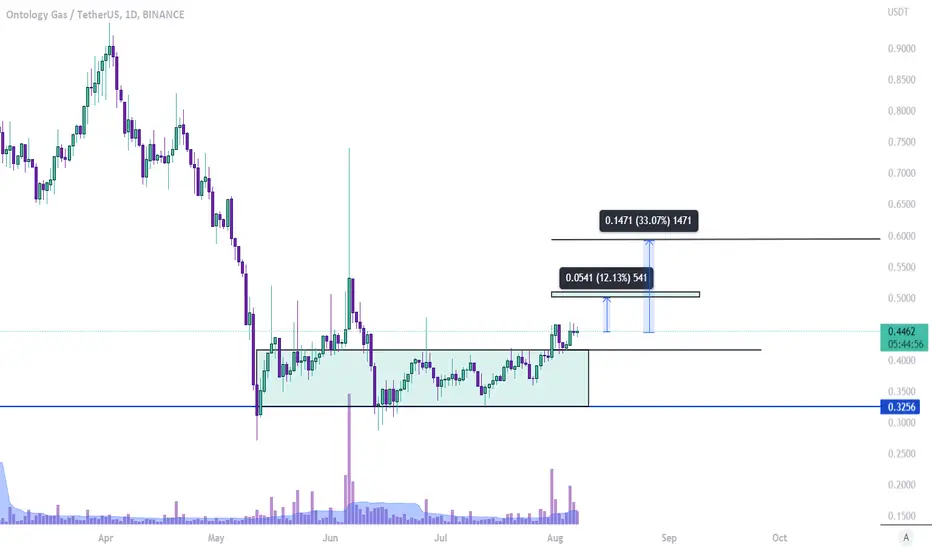
Ong Looking Good For Midterm Seems Like Ong Bottomed Out & formed Falling Wedge In 2Day Timeframe
Incase Of breakout Expecting 170 to 180% bulish move

#ONG/USDT [Ontology Gas]: Bollinger_Breakout Super_TrendWe've identified both a Bollinger Band breakout and a Super Trend pattern on the ONG/USDT chart. Both indicators are signaling a bullish trend, with the Bollinger Band indicating a potential bullish trend as the price has moved outside of the upper band and the Super Trend showing a bullish trend. This is a stronger bullish signal as both indicators are aligned. It may be a good idea to consider buying at the current price zone and targeting higher levels. However, it is still important to consider other factors such as overall market conditions, and other technical indicators before making a trade decision.

ONGUSDT#ONGUSDT
(LONG SIGNAL)
(SWING TRADE)
MACD is showing bullish
EMAs showing a bullish move
RSI is neutral
this is really important support zone because in february 2021 the price flew from this zone to 3.30 $ so that let us focus at this opportunity buy and hold it and waiting for next targets at the chart
targets set at the chart

ONGUSDT#ONGUSDT
(LONG SIGNAL)
(SWING TRADE)
this is really important support zone because in february 2021 the price flew from this zone to 3.30 $ so that let us focus at this opportunity buy and hold it and waiting for next targets at the chart
MACD is showing bullish
EMAs showing a bullish move
RSI is neutral
targets set at the chart

ONGOng chart
keep ur eyes on
one of the best
this is not a financial device
everything i do is just for fun
ONG\USDT 📐ASCENDING TRIANGLE📐🇺🇸Hello friends👋!
📈Long: 5-7% of the deposit
🔴SL: $0.3518
🟢TP: 0.5800$
An Ascending Triangle formed on the 1D timeframe, the upper limit was broken on an increased volume and the price fixed, long📈.


ONG Ready To PumpVery good conditions to rise up and give us good pump
Positive Divergence
About 50-60% profit , With good risk management -10% radio
1.2$ - 1.25$ As a Target
its all about time to make it
Good Look

ONGUsdt Updatethis is update but rememebr watch BTC market fall so all alt can fall
better you dont wait long time and fast leave after profit
you can use resistances for targets have fast got profit and leave
and you analyse for short positions can use supports for targets GL
EntryPoint:
0.6258
0.5693
Supports:
0.5237
0.4537
0.3962
0.3202
0.2502
ResistanceS:
0.7335
0.8268
Targets:
0.9446
1.0623
1.3026
1.5949
2.1324
3.0801
GL

🆓Ontology Gas (ONG) Jan-24 #ONG $ONG
ONG is forming a Broadening Falling Wedge pattern and if it holds the $0.55 zone then we could see a strong rally to the $1.2 zone in the near term. But if it loses the $0.55 zone, it will continue to fall sharply and may fall back to the $0.35 zone
📈RED PLAN
♻️Condition : If 1-Day closes ABOVE 0.55$ zone
🔴Buy : 0.55
🔴Sell : 0.7 - 0.85 - 1 - 1.2
📉BLUE PLAN
♻️Condition : If 1-Day closes BELOW 0.55$ zone
🔵Sell : 0.55
🔵Buy : 0.35
❓Details
🚫Stoploss for Long : 10%
🚫Stoploss for Short : 5%
📈Red Arrow : Main Direction as RED PLAN
📉Blue Arrow : Back-Up Direction as BLUE PLAN
🟩Green zone : Support zone as BUY section
🟥Red zone : Resistance zone as SELL section

ONGUSDT UPDATEHello friends,
Welcome to our ONGUSDT 4h chart.
As we can see in the chart how the ASCENDING TRIANGLE is forming.
Which is a Bullish sign.
Thank you
And
God bless you all!!


ONGUSDTI think ONG will fall to the level of 0.9056, then we will see its behavior in dealing with that level if we see signs of a return then buy it.

#ONGUSDT (Watchlist)#ONG maybe worth it to add this coin to your Watchlist. 👀
Everything mentioned on the chart (Pattern/Resistance/Support / Breakout/Breadkwon levels, Also R: R)
add to watchlist means the coin we mentioned is forming a pattern or moving near a historical bottom, around or above good support, increase in trading volume, showing a reversal candle, accumulation stage, etc, but no reaction from bulls, so we inform you to add it to your watchlist until the right time for entry.!!
Ps:
we avoid trading any coin if the entire project for it is based on gambling, prostitution, human trafficking, etc.
This is not financial advice, The purpose of these Charts is to give you an idea about coin movement (not buy or sell signal) so before following any idea be sure to do your own research, and follow your risk management. Also, the information we mentioned here is a personal effort that is subject to success or failure and we welcome constructive criticism.
Pressing the "like button" and leaving your "comments" below our ideas is great and supports us in providing more ideas.❤️
Good luck to All.
🙏we ask Allah reconcile and repay🙏

ONGUSDTONG giving good opportunities for quick and easy money as it price regularly jumping due to whales manipulations.
Buy now and TP around 1.9000.
BINANCE:ONGUSDT
BITTREX:ONGUSD BINANCEUS:ONTUSDT

Ontology Gas (ONG) - October 9Hello?
Welcome, traders.
By "following", you can always get new information quickly.
Please also click "Like".
Have a nice day.
-------------------------------------
(ONGUSD 1W Chart) - Mid-Long-Term Perspective
Above 0.3938 point: expected to continue uptrend
(1D chart)
First support section: near point 1.2443
Second support section: 0.6506-0.8485 section
First resistance section: 1.6402-0.18381 section
Second resistance zone: near the 2.4318 point
If the price holds in the 1.2443-1.6402 range, I expect it to move towards the first resistance level.
A short-term Stop Loss is required if the decline is from the 1.1368-1.2443 section, the first support section.
A decline in the second resistance area could touch the 0.3938 point, so trade cautiously.
-----------------------------------------------------
(ONGBTC 1W Chart) - Mid- to long-term perspective
Above the 3272 Satoshi point: expected to turn into an uptrend
Over 8000 Satoshi points: Expected to create a new wave.
(1D chart)
------------------------------------------
We recommend that you trade with your average unit price.
This is because, if the price is below your average unit price, whether it is in an uptrend or in a downtrend, there is a high possibility that you will not be able to get a big profit due to the psychological burden.
The center of all trading starts with the average unit price at which you start trading.
If you ignore this, you may be trading in the wrong direction.
Therefore, it is important to find a way to lower the average unit price and adjust the proportion of the investment, ultimately allowing the funds corresponding to the profits to regenerate themselves.
------------------------------------------------------------ -----------------------------------------------------
** All indicators are lagging indicators.
Therefore, it is important to be aware that the indicator moves accordingly with the movement of price and volume.
However, for the sake of convenience, we are talking in reverse for the interpretation of the indicator.
** The MRHAB-O and MRHAB-B indicators used in the chart are indicators of our channel that have not been released yet.
(Because it is not public, you can use this chart without any restrictions by sharing this chart and copying and pasting the indicators.)
** The wRSI_SR indicator is an indicator created by adding settings and options to the existing Stochastic RSI indicator.
Therefore, the interpretation is the same as the traditional Stochastic RSI indicator. (K, D line -> R, S line)
** The OBV indicator was re-created by applying a formula to the DepthHouse Trading indicator, an indicator disclosed by oh92. (Thanks for this.)
** Support or resistance is based on the closing price of the 1D chart.
** All descriptions are for reference only and do not guarantee a profit or loss in investment.
(Short-term Stop Loss can be said to be a point where profit and loss can be preserved or additional entry can be made through split trading. It is a short-term investment perspective.)

OGNUSDT is testing the weekly resistance OGNUSDT is testing the weekly resistance. If the price is going to have a breakout from the weekly resistance and turn the current resistance into new weekly support, According to Plancton's strategy (check our Academy ), we can set a nice order
–––––
Follow the Shrimp 🦐
Keep in mind.
🟣 Purple structure -> Monthly structure.
🔴 Red structure -> Weekly structure.
🔵 Blue structure -> Daily structure.
🟡 Yellow structure -> 4h structure.
⚫️ Black structure -> <4h structure.

ONG/USDTIt is possible to have a correction to the level of 0.8,But if it is not corrected and it climbs, it will rise to the levels I have specified.
TP1:1.5$
TP2:2$
TP3:3$
TP4:4$
