ONTBTC trade ideas


Ontology (ONT) Bounce from support, likely drop, possible long.Ontology just had a bounce from lows with the obvious bull div indicating rising support. Now this is the first zone of resistance that we could not break before. The RSI shows a lack of support at this price, so be cautious.
I would consider going long once the cloud is breached. This is because we are previous support as indicated by the 1 day graph. A bounce is not uncommon when this happens. I believe a bear flag will occur here, which might be a good 5-10% trade.
The only problem is that I feel BTC still has more room to drop, so I am more inclined to believe this rally will fail. I am posting this because ONT is just so incredibly low it will be interesting to come back in a few weeks and see if support has held or we are on path to 2264.
For long term players, pick up some here.
Thanks for viewing. Hope you are doing well in this market. If it makes you feel any better I lost over 10% on TRX after transferring it to my online wallet to participate in voting only to have btc fall. Keep in mind I had to lock my TRX for a period of 3 days, so I could not do anything and had to eat this loss. If you are short, congratulations on the xxx% gains.

ONTBTC Got good potential 100-250% Profit TargetIt completed Corrective waves ABC and started a fresh impulsive wave up.
Possible Entry and exit targets are clearly stated on the chart.
BLUE: POSSIBLE ENTRY ZONE
RED: STOP LOSS LEVEL
GREEN: SELL TARGETS
Join our discussion room for more about our trading signals.
Please do click on like icon and share our idea.
Thanks.
Note:
It will be good to always understand risk involve in trading. Always trade with stop Loss in place.
Set up an entry/exit strategy for every trade, with good risk/reward ratio.

ONT/BTC getting ready to blow its lidNot to often you find all 3 indicators lining up perfectly, and on a major support. This trade is a no brainer

ONT / BTC // LONG SIGNAL // Patterns BAT // Impotant supportsont 1.89% btc -5.78% is forming a very interesting BAT pattern ..
for those who wish to invest in the long term we are already positioned
and crenado a block that really the price parce that is respecting. let's wait for a positive operation
there are always good opportunities in the markets
"""PATIENCE!!!!!!

ONT back to 2$ rangelife is good and give you chances everyday :)
time to buy and hodl this gem make ong and get rich in few months ;)
good luck all

Entered a 36% probability of going to 271Sat by Aug10 Glad I haven't touch Ontology yet, but will consider to enter a small position soon depending of how the price is behaving until Aug10.
Not trying to catch a falling knife so watching closely what's going to happen between the Green and Purple area.
The Blue doted line is the marker for my Cindicator bet. I entered a 36% chance that we could trade below 0.000271 by Aug 10. I think we are going to get there but Aug 10 is kind of near even if price can move fast for the ALTs with the CBOE ETF status pending. If approved people will sell ONT to go to BTC while it's dominance is pretty high right now.
Let's see how the Last GreenColorPrice @0.0002850 will behave
Of course another #FreeColorChart for all who want to put more Colors in their trading and investment strategies.
#G.Baz ---- #TheColorChartist ---- #Cidicatorian402 ---- #36%Bet

ONT Going UpONT has broken out of the falling wedge, and has now bounced off of a very strong long term support on the hourly charts. The rsi on the daily has been oversold for a while, which is also the first time it has been oversold in the history of ONT trading on Binance. This might be a good trading opportunity. Cheers and goodluck trading guys.


Ontology Bottom of the Channel is in!Yes we are almost at the bottom of the channel, combine this with btc reversal soon, Ontology might reach for the sky!


ONT - FIB SALE for Ontology - 78.6% of it's June/July pricesLooking at the daily chart for Ontology, it has a very fast correction and is finding support on the .786 Fib retracement mark. Bullish divergence on the CCI and a bullish crossover on the MACD may indicate greener candles in the near future. I'll be watching for a confirmation bounce showing me strong buyer support, but this is a steal of a price.

ONT/BTC 8hr...It's Cheap, Why Not...Just an idea for myself. I am currently accumulating all these worthless coins...
Not Financial Advice
longmoney

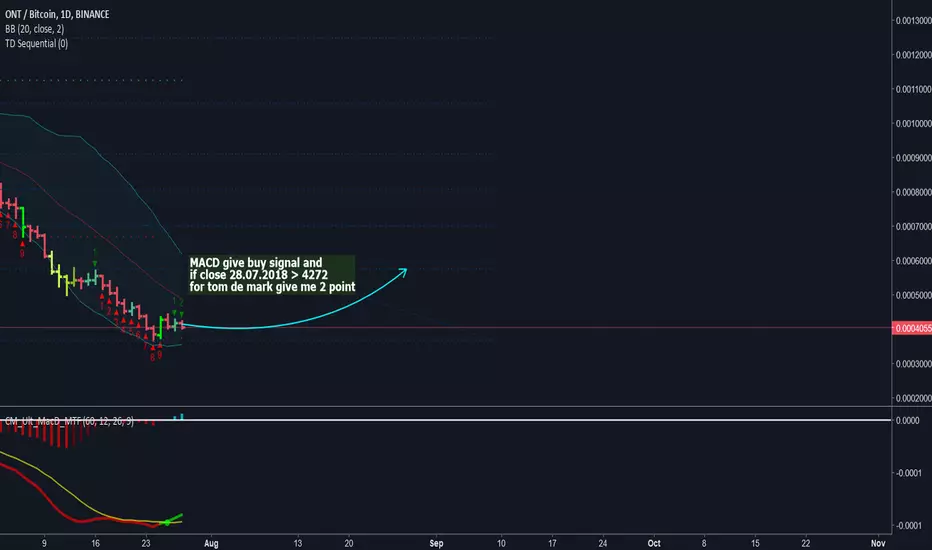
ONT macd Buy signalONT show give signal but tom de mark system is not yet buy signal so we waiting tom de mark 2 point so close the today up to 4272
$ONT Levels that I'm watchingWeekly S/R in Pink
Daily S/R in Purple
Watching how this plays out - staggering buy orders starting from 3.336k to 2.718k satoshis.

ONTOLOGY - FREE FALLING. Where will it stop?Ontology has been falling freely since 7 June. The price has depreciated by 68%.
It is moving below 9-day EMA which is a big problem. It is now moving into a critical zone, 0.786 Fibonacci level.
This corresponds to 0.0003575 BTC. The RSI has been way too oversold for so long. It's just a matter of time when it reverses.
It should rebound from the 0.786 level else it's gonna run into some serious trouble.
The profit taking targets can be next fibonacci levels.!
Wait for the signs of reversal before entering any long positions. If the current support level holds then i will enter the trade.
(I can post the chart with in depth analysis using indicators if people need it, but as for now, this should suffice.)
P.S: This is not an investment advice. This is for learning purposes only. This is my personal journal. Invest your capital at your own risk.
Keep an eye out. Trade safely. Always remember, money not lost is also a profit.
Good luck trading.!
Peace.

ONT looking bearish As it is the case with many other altcoins, ONT is looking bearish. Similarly to IOTA, ONT performed a perfect re-test pattern and continues to go down it seems. The coin is still trading within a channel/wedge and it is unable to test the resistance of the channel but on the other hand, it is constantly creating a series of new lows. The price action failed two times at the horizontal resistance area and it is now pushing down again. The first level of support is the previous horizontal support to the pair around 0.0003700, if that breaks, then look for a bigger move to the downside to test the channel support. For the coin to recover, it first needs to clear the horizontal resistance before eventually racing higher to test channel resistance in the 0.000300 - 0.000320 area.
ONT finally looks to confirm its bottom.ONT has been in freefall for quite some time but it looks to have finally completed it's selling here with the MacD reaching it's bottom and crossing over at last. The weekly chart also saw ONT as one of the most oversold currencies in the whole market and the daily RSI remains low. The daily and weekly 9 in conjunction should give this a strong bounce as long as market conditions stay half decent. Take a look at the hourly chart as well which is creating a nice ascending triangle, next step up looks like it could come later today.

ont good area buy now 4400
sell 7400
stop 4300
low stop very high target
it could very fast to achieve target
today is reflection day

ONTBTC Correction time is over!!! 50-150% Profit TargetPrice bounced off 78.6% fib retracement level and this could mark the end of correction for ONT and it expected to start upward impulsive waves.
Possible Entry and exit targets are clearly stated on the chart.
BLUE: POSSIBLE ENTRY ZONE
RED: STOP LOSS LEVEL
GREEN: SELL TARGETS
Join our discussion room for more about our trading signals.
Please do click on like icon and share our idea.
Thanks.

How I feel about most alts right now...Aside from a few strong performers at the moment (DGB) most alt charts are close to retracing all the way back down to a bottom. Ont looks to be on a clear path back down to the floor also, especially now the main net is live and hype has dissolved.
So yeah, no technical analysis here really, more a tongue in cheek representation of the crypto market right now... this is even more prevalent on exchanges like Kucoin.

ONT has showed some life but i think we have a lot further to goMy Fibs origin is at 0.0000001 due to the airdrop to the community ONT had performed very well during the bear market but unfortunately, I see a long way before we hit the bottom, Volume has dropped by 75% and the market is being dominated by bots so they will dictate ONT path. We saw a decent little bounce today as bitcoin began ranging sideways and the sellers are still out in force. 79% retracement will place us in the 26k sat range, i am looking to buy at the weekly order block of 22k sats and the daily order block of 16k sats to complete the retracement and preparation for the next big run. REMEMBER this coins bottom was literally 0 a few months ago.
Happy Trading
