ONT NEW UPDATE (1D)Hi, dear traders. how are you ? Today we have a viewpoint to SELL/SHORT the ONT symbol.
For risk management, please don't forget stop loss and capital management
When we reach the first target, save some profit and then change the stop to entry
Comment if you have any questions
Thank You
ONTUSDT trade ideas


ONTUSDTONTUSDT
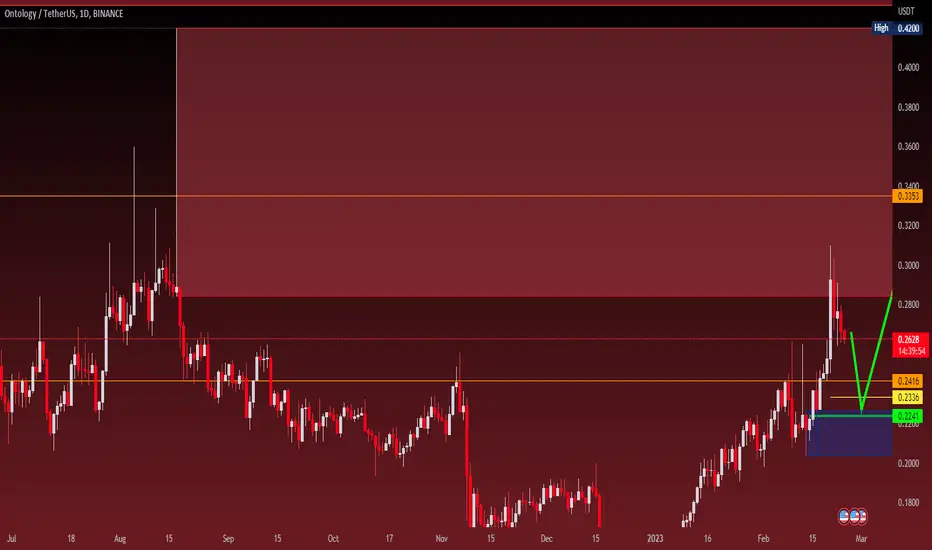
Daily time frame
The continuation of the upward trend will have a correction of the 0.2618 area break
Step buy with respect to capital management area 0.2416 or 0.2241
Target 0.3353 and 0.4900


ONT Buy TimeHello Traders!
Welcome back to another trade with analyst Aadil1000x.
Today we are setting Buy limit in ONT at key reversal line and there is also a strong support which is another bonus point.
ONT BUY limit 0.1773
Stoploss 0.1744(-1.64%)
Target 1, 0.1806(+1.88%)
Final Target 0.1848(+4.2%)
Don't forget to hit the like button and follow to stay connected

ONTUSDT is testing the resistanceThe price tested the dynamic support on the daily timeframe, and now the market is trying to have a breakout from the 4h resistance.
how to approach it?
IF the price is going to have a breakout, According to Plancton's strategy , we can set a nice order
–––––
Keep in mind.
🟣 Purple structure -> Monthly structure.
🔴 Red structure -> Weekly structure.
🔵 Blue structure -> Daily structure.
🟡 Yellow structure -> 4h structure.
⚫️ black structure -> <= 1h structure.
–––––
Follow the Shrimp 🦐

ONTusdt X3
This is the first investment purchase since the beginning of the fall of the crypto market.
The instrument has been accumulating for 5 months, volumes have decreased to a minimum, all sales at the 0.2 support level are being redeemed, the price is 0.2 historical minimum. The potential of the move is up to 0.4 and 0.6 in the next few months, in the long run 1 dollar.


ONT reached resistance.This is an ONT idea.
ONT just pumped and reached the 1H resistance level.
There are two resistance levels on the way up and two support levels on the way down.
We have two possible scenarios:
Scenario One:
The price will reach the solid resistance level and get rejected to touch the local resistance for confirmation.
Scenario Two:
The price will get rejected, supported locally, and pushed back up again.
As you can see on the chart, this coin has reached 2 levels of resistance on the hourly and daily timeframes based on the Fibonacci retracement.
RSI is oversold, and the price has more room to go down.
Now let's see your ideas. Let's have a discussion.
Let me know if you guys have any questions;
I will be more than happy to help.
Good luck, and thank you.


#ONT/USDT - SHORT HedgeCheck out my parallel ideas for BTC and IOTA. We're running 3 scalps 2 longs and one short as a hedge.
#ONT/USDT
SHORT
LEVERAGE: 10-20X (Recommended)
ENTRY: 0.22230
TP1: 3.07%
0.21555
TP2: 5.47%
0.21015
SL: 1.51%
0.22565

ont spot signal Free
#ONT/USDT
Exchanges: Binance
Signal Type: Regular (Long)
Amount: 2.0%
💎 Entry Targets:
1) 2140- 2079
Take-Profit Targets:
Target 1: 2167
Target 2: 2205
Target 3: 2236
Target 4: 2266
Target 5: 2310
Target 6: 2365
Target 7: 2567
Target 8: 2646
🚫 Stop loss:
2015

ONTUSDT Good buy!ONTUSDT Technical analysis update
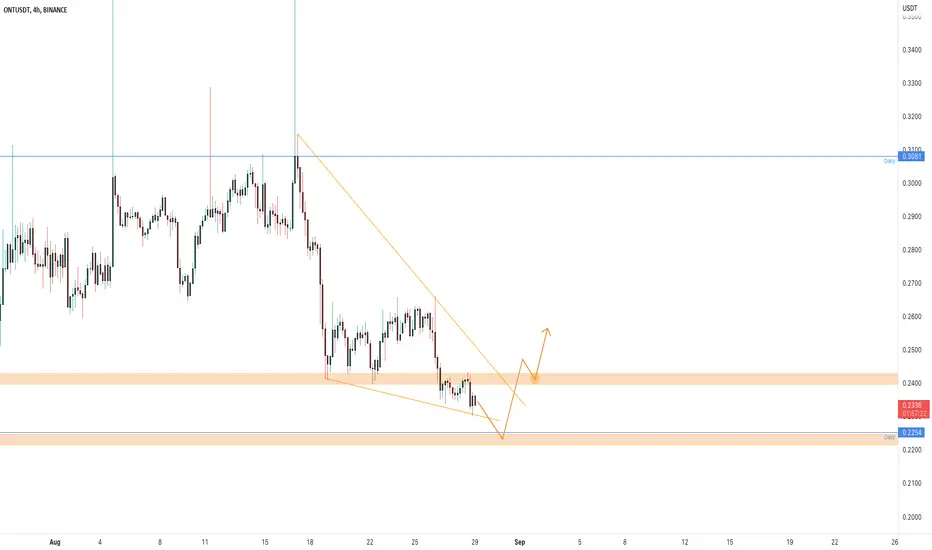
ONT formed a falling wedge pattern in the 4 charts.
Buy zone : $0.226 - $0.232
Stop loss : $0.217
TP 1 : $0.241
TP 2 : $0.250
TP 3 : $0.280
Always keep stop loss
Thanks
Hexa

ONT good for mid-termBuy setup
Entry : 0.185 to 0.228
SL : 0.160
TP1: 0.235
TP2: 0.243
TP3: 0.255
TP4: 0.27
TP5: 0.29
TP6: 0.31
TP7: 0.34
TP8: 0.38
TP9: 0.42
TP10: 0.47
TP11: 0.52
TP12: 0.59
TP13: 0.66
TP14: 0.74
TP15: 0.84
TP16: 0.94
TP17: 1.04
Spot or Future (1x, 2x, or 3x)
Run and keep it enjoy!
Follow me! Copy my trade!
TradeSetup_Reza

ONT +10%: Time to take actionHello traders!
ONT episode continues as it has only achieved half of its target size. It's +10% profit and with 5x leverage, it's 50% profit.
It's time to move your Stoploss at entry and take some profit. You can close 25/50/75/100 percent, it is your choice.
I am still expecting a bullish spike in ONT as other markets will fall and ONT will rise.
In any case, if ONT moves down then our stoploss should be in the safe position.

Another Trade like GALHello traders!
Welcome back to another episode with Analyst Aadil1000x
Today we are going to BUY ONTusdt. Again i am telling overall market is not bullish it's the ONT which is showing Bullish pattern and we are buying it now.
ONT buy now, It's at 0.2237
Stoploss 0.2104(-5.8%)
Target 1 0.2459(+10%)
Target 0.2679(+20.1%)
Suggested leverage 4x-7x

ONTUSDTHello Crypto Lovers,
Mars Signals team wishes you high profits.
This is a 4-hour-time frame analysis for ONTUSDT
Here we have R2 and R1 as the resistance areas that both express the price was unable to rise at several points. And S1 is our support area that shows the well support of the price since the past. At the present, we have the price fluctuating below R1 and we expect it will fall to S1 as its past behavior. Here we must wait for some confirmation candles and our expectation would be a rise to R1. We believe it is not so possible for the price to face more decline below S1 and therefore the rise will be our prediction to happen in the coming days.
Warning: This is just a suggestion and we do not guarantee profits. We advise you to analyze the chart before opening any positions.
Wish you luck

ONTUSDT is forming a falling wedgeThe price is forming a falling wedge on the daily support at 0.22$ area between the 4h structures.
How to approach it?
The price could get more liquidity from the 0.22-21 area and create a reversal trade.
so, IF AND ONLY IF, the price is going to have a breakout from the falling wedge and 4h resistance and retest as new support, According to Plancton's strategy , we can set a nice order
–––––
Keep in mind.
🟣 Purple structure -> Monthly structure.
🔴 Red structure -> Weekly structure.
🔵 Blue structure -> Daily structure.
🟡 Yellow structure -> 4h structure.
–––––
Follow the Shrimp 🦐
TRADE PLAN FOR ONT FOR PROFITSHello traders, opportunity on ONT , history will always repeat itself and you can look at the previous sudden pump , i beleive we should be able to catch this one for over 25% gain.
tradehubng

Ont/USDT Hit or Miss Series Ep1Hit or Miss Series is originally high quality trades but has a 50:50 chances of success.So its for the traders who have tons of money to lose.
And for me who wants to collect more data and gain more experience and for new traders who just want to find very good levels.
Pro tips: Entry TF×3= Very Good Levels
P. S. THIS IS NOT A FINANCIAL ADVICE

ONTUSDT Short Setup!ONTUSDT Technical analysis update
Short level: $0.243 - $0.247
Stop loss : $0.260
TP 1 : $0.230
TP 2 : $0.221
TP 3 : $0.207
TP 4 : $0.192
Max leverage: 1x
Always keep stop

ONT/USDTONT/USDT
Currently, it has managed to keep KH above the resistance of 25 cents.
It is expected that we will have a price increase of 45 cents and then experience a drop from that area.
#ONT #ONTUSDT #BTC #BTCUSD #LUNA #LUNC #UST
