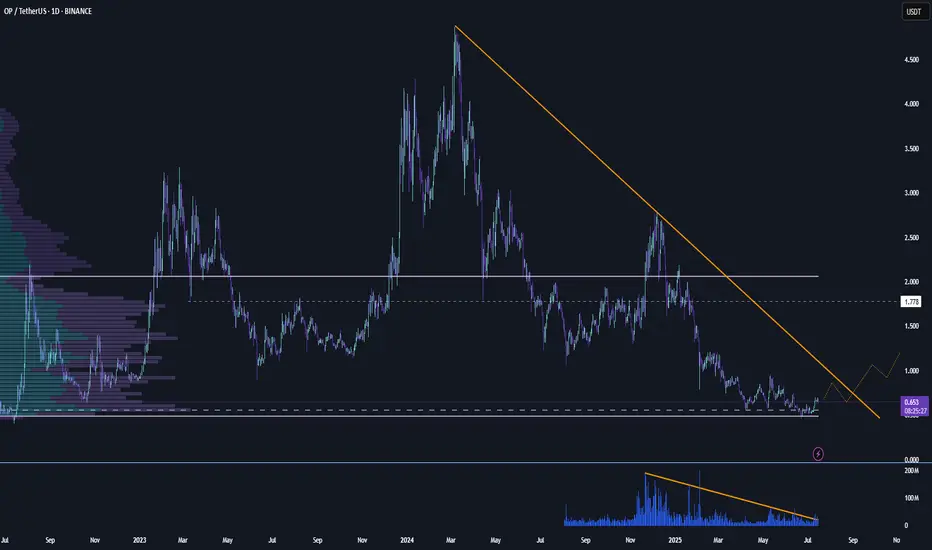
Optimism Op price analysis - be careful After the listing of #OP on the Korean exchange, known for its "pump events", we observe a surge in volume along with a breakout from the downtrend.
🐻 The current 6-hour candle on OKX:OPUSDT is attempting to form a pin bar — a potential reversal signal.
⚠️ High volumes often indicate the final
Related pairs

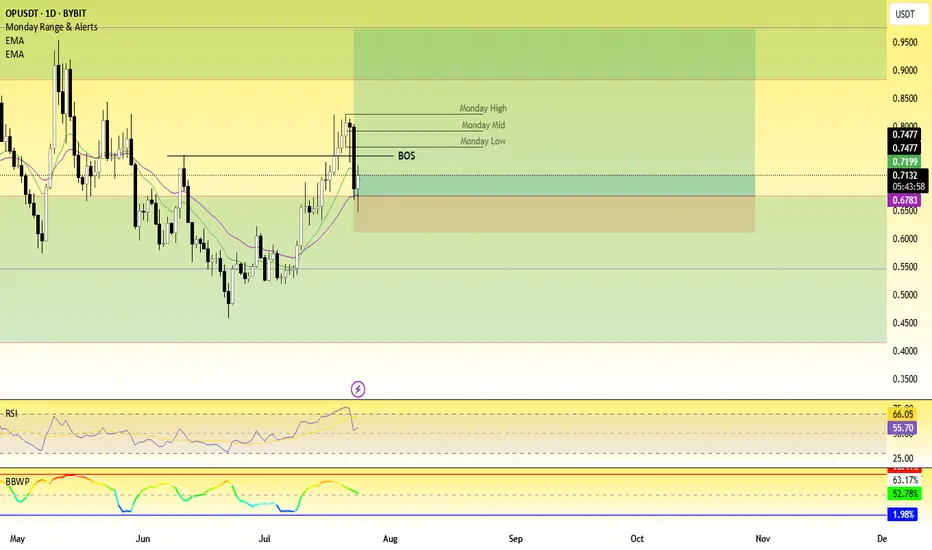
OP - Chance for +70%After weekly close we can see the volume coming in. On the chart we have resistance which if we break through then we can expect price 1.4 which is +70% from now.
If I have some advice for leverage trading I think its better to wait for daily close and then hunt retest if happens.
Rotations of m

OPUSDT Maintains Bearish MomentumOPUSDT continues its decline following the breakdown from a massive rising wedge. After a clean corrective pullback, price formed a bearish continuation structure, which has now broken into a descending channel guiding the current move.
The chart suggests further downside toward the projected drop


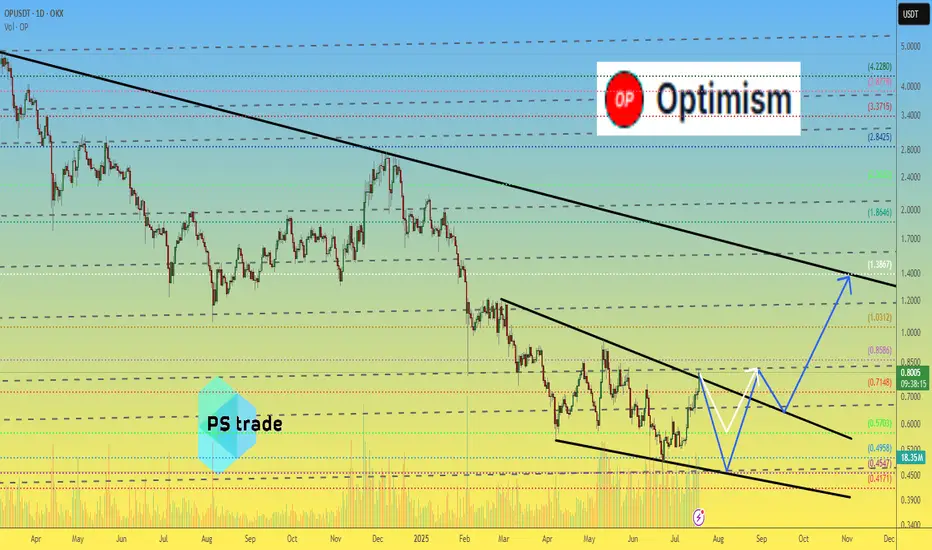
Optimism OP price analysisCurrently, the price of #OP does not look very optimistic (a little pun to start with )))
🟢 An optimistic forecast would be for the price of OKX:OPUSDT to rise to $1.40
🟡 But it looks like this growth will not happen now, but after a correction.
🔴 Correction: only to $0.57 or again to $0.45 — t
1d OP - Long setupToday I set up a low lev (2x) long with a 7:1 rr on BINANCE:OPUSDT
Reason being that it seems to have bottomed out. fairly close to the VAL and POC. both are at 50 cent and 55 cent respectively. I'd consider adding a little margin IF it comes close to that area. around 48/49 cents I'd consider m

OPUSDT Update
Symbol: OP/USDT
Timeframe: Daily
Chart Analysis:
The price is currently approaching a key resistance zone at around 0.673, as seen in the chart. A descending trendline from May to June has been acting as resistance. The price has recently made a strong move towards this resistance zone, showing a

1d OP (short idea)currently BINANCE:OPUSDT looks very bottomed out, approaching a key downward resistance in the next days. if the volume picks up, and the sentiment is there - I think it will pick up quite well.
See all ideas
Summarizing what the indicators are suggesting.
Oscillators
Neutral
SellBuy
Strong sellStrong buy
Strong sellSellNeutralBuyStrong buy
Oscillators
Neutral
SellBuy
Strong sellStrong buy
Strong sellSellNeutralBuyStrong buy
Summary
Neutral
SellBuy
Strong sellStrong buy
Strong sellSellNeutralBuyStrong buy
Summary
Neutral
SellBuy
Strong sellStrong buy
Strong sellSellNeutralBuyStrong buy
Summary
Neutral
SellBuy
Strong sellStrong buy
Strong sellSellNeutralBuyStrong buy
Moving Averages
Neutral
SellBuy
Strong sellStrong buy
Strong sellSellNeutralBuyStrong buy
Moving Averages
Neutral
SellBuy
Strong sellStrong buy
Strong sellSellNeutralBuyStrong buy
Displays a symbol's price movements over previous years to identify recurring trends.
Frequently Asked Questions
The current price of Optimism/Tether (OP) is 0.6437 USDT — it has fallen −2.26% in the past 24 hours. Try placing this info into the context by checking out what coins are also gaining and losing at the moment and seeing OP price chart.
Optimism/Tether price has fallen by −5.96% over the last week, its month performance shows a 23.62% increase, and as for the last year, Optimism/Tether has decreased by −59.31%. See more dynamics on OP price chart.
Keep track of coins' changes with our Crypto Coins Heatmap.
Keep track of coins' changes with our Crypto Coins Heatmap.
Optimism/Tether (OP) reached its highest price on Mar 6, 2024 — it amounted to 4.8601 USDT. Find more insights on the OP price chart.
See the list of crypto gainers and choose what best fits your strategy.
See the list of crypto gainers and choose what best fits your strategy.
Optimism/Tether (OP) reached the lowest price of 0.3965 USDT on Jun 18, 2022. View more Optimism/Tether dynamics on the price chart.
See the list of crypto losers to find unexpected opportunities.
See the list of crypto losers to find unexpected opportunities.
The safest choice when buying OP is to go to a well-known crypto exchange. Some of the popular names are Binance, Coinbase, Kraken. But you'll have to find a reliable broker and create an account first. You can trade OP right from TradingView charts — just choose a broker and connect to your account.
Crypto markets are famous for their volatility, so one should study all the available stats before adding crypto assets to their portfolio. Very often it's technical analysis that comes in handy. We prepared technical ratings for Optimism/Tether (OP): today its technical analysis shows the sell signal, and according to the 1 week rating OP shows the sell signal. And you'd better dig deeper and study 1 month rating too — it's sell. Find inspiration in Optimism/Tether trading ideas and keep track of what's moving crypto markets with our crypto news feed.
Optimism/Tether (OP) is just as reliable as any other crypto asset — this corner of the world market is highly volatile. Today, for instance, Optimism/Tether is estimated as 8.08% volatile. The only thing it means is that you must prepare and examine all available information before making a decision. And if you're not sure about Optimism/Tether, you can find more inspiration in our curated watchlists.
You can discuss Optimism/Tether (OP) with other users in our public chats, Minds or in the comments to Ideas.