[Deep Dive] OP – Edition 4: Accumulated Pressure!Optimism (OP) may be quietly setting the stage for a classic reversal play — with structure, sentiment, and cycle theory all lining up.
After a sharp markdown throughout Q4 2024 and early 2025, OP has spent several months forming what appears to be a rounded accumulation base. And if history rhymes, a markup phase could be next.
🔍 Phase Breakdown
📉 Markdown
The aggressive downtrend sent OP tumbling from above $3 all the way to the $0.50–$0.60 support region, wiping out months of bullish structure and triggering capitulation.
📦 Accumulation
Since then, the price has been compressing sideways in a tight range, respecting the $0.50 psychological zone while creating a rounded bottom pattern. This sideways action — combined with declining volatility — suggests sellers are exhausted, and accumulation may be underway.
📈 Markup Potential
The current setup mirrors textbook market cycles, where markdown gives way to accumulation, followed by expansion. If OP breaks above the $0.70–$0.85 resistance zone with volume, the door opens for a rally toward $1.85 and even $2.00 — the next key supply zones.
⚙️ Fundamental Fuel
Optimism is more than just a Layer 2 — it’s the engine behind the Superchain vision. With OP Stack now powering not only Optimism but also chains like Base and Zora, the protocol is becoming the backbone of Ethereum’s scalability roadmap.
Recent key updates include:
- New governance structures via RetroPGF Round 3 distribution.
- Continued expansion of OP Stack rollups.
- Growth in on-chain activity and TVL thanks to Base's rapid adoption.
All of this adds up to strong long-term tailwinds — especially if Ethereum Layer 2 narratives reheat.
🧠 What to Monitor Next
🔍 Break above $0.85 = confirmation of phase shift.
📊 $0.50 remains the key invalidation level for the current bullish thesis.
🧨 Watch for volume spikes near resistance — they often precede explosive markups.
💬 Are we witnessing the calm before Optimism’s storm — or just another pause in a longer downtrend?
🔔 Disclaimer: This post is for educational and informational purposes only. It does not constitute financial advice. Always do your own research and manage risk carefully.
📚 Always follow your trading plan => including entry, risk management, and trade execution.
Good luck!
All strategies are good, if managed properly.
~ Richard Nasr
OPUSDT trade ideas

TradeCityPro | OP Eyes Breakout in Prolonged Altseason Range 👋 Welcome to TradeCity Pro!
In this analysis, I want to review the OP coin for you — one of the Layer 2 projects whose token currently holds a market cap of $1.39 billion and is ranked 68th on CoinMarketCap.
📅 Daily Timeframe
On the daily timeframe, OP is moving within a range box between 0.521 and 0.920, which formed after a downtrend, and the price has been fluctuating in this box for several months.
🔑 One key resistance on this coin is 0.816, which can be used as a trigger for a long position.
📈 This trigger can also be used for spot buying, but given its Bitcoin pair, I prefer to take the position in futures and reserve spot buys for future triggers.
💥 For momentum confirmation of this position, we can use RSI’s entry into the Overbought zone, since RSI is currently near this area, and if it enters, it could support a strong upward move.
📊 The next long trigger is the breakout of 0.920. However, this trigger is not valid at the moment because the price hasn’t reacted to it for a long time, and in the future, if it does react, the level will likely change. In that case, I’ll update the analysis and give you the new trigger.
✔️ If OP declines, the first important support we have is 0.626. A close below this level could allow for a risky short position, but for shorts, I’ll personally wait for a break below 0.521.
📝 Final Thoughts
Stay calm, trade wisely, and let's capture the market's best opportunities!
This analysis reflects our opinions and is not financial advice.
Share your thoughts in the comments, and don’t forget to share this analysis with your friends! ❤️

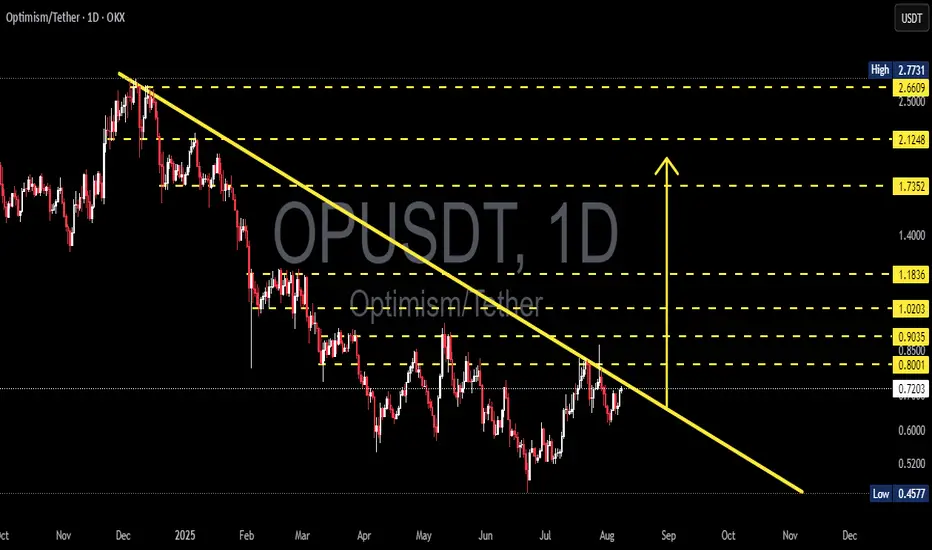
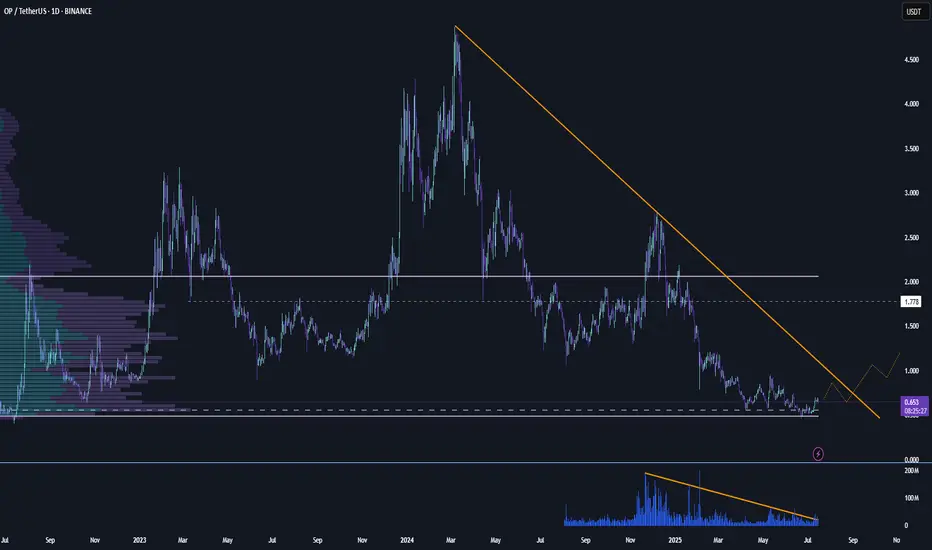
OP/USDT Technical Analysis – Approaching a Major Breakout Zone!Chart Overview: The OP/USDT pair on the 1D (Daily) timeframe is currently moving within a long-term descending trendline, forming a descending triangle or falling resistance channel since November 2024. The price is now approaching a critical point near the long-term resistance trendline (yellow line), which has been tested multiple times.
---
🟢 Bullish Scenario: Breakout Potential
If the price manages to break and close above the descending trendline resistance (currently near the $0.80–$0.85 zone), it would signal a strong bullish breakout. The next key resistance levels to watch (based on yellow dotted horizontal lines) are:
1. $0.9035 – minor resistance
2. $1.0203 – psychological level
3. $1.1836 – mid-term strong resistance
4. $1.7352 and $2.1248 – extended bullish targets
A confirmed breakout would ideally be supported by increasing volume and RSI momentum above 50.
---
🔴 Bearish Scenario: Rejection at Resistance
If the price fails to break the trendline and gets rejected, a downside move is likely to follow. Key support levels to watch are:
1. $0.7200 – current support
2. $0.6000 – minor support
3. $0.4577 – strong historical support (lowest level)
This would suggest continued bearish control and could extend the downtrend that has lasted over 8 months.
---
📊 Pattern Breakdown: Descending Trendline
Consistent lower highs since the peak near $2.77
The descending trendline is the main battle zone between bulls and bears
This pattern often leads to a breakout if buyers gain momentum
---
🎯 Conclusion & Strategy:
This is a critical zone for OP/USDT.
Traders should wait for breakout confirmation before entering long positions.
For breakout traders: consider a buy-the-breakout strategy with stop-loss below the trendline.
For short sellers: look for a rejection at resistance with targets at the nearest support levels.
#OPUSDT #CryptoAnalysis #Altcoins #TechnicalAnalysis #BreakoutTrade #Optimism #CryptoSetup #BullishScenario #BearishScenario #ChartPatterns
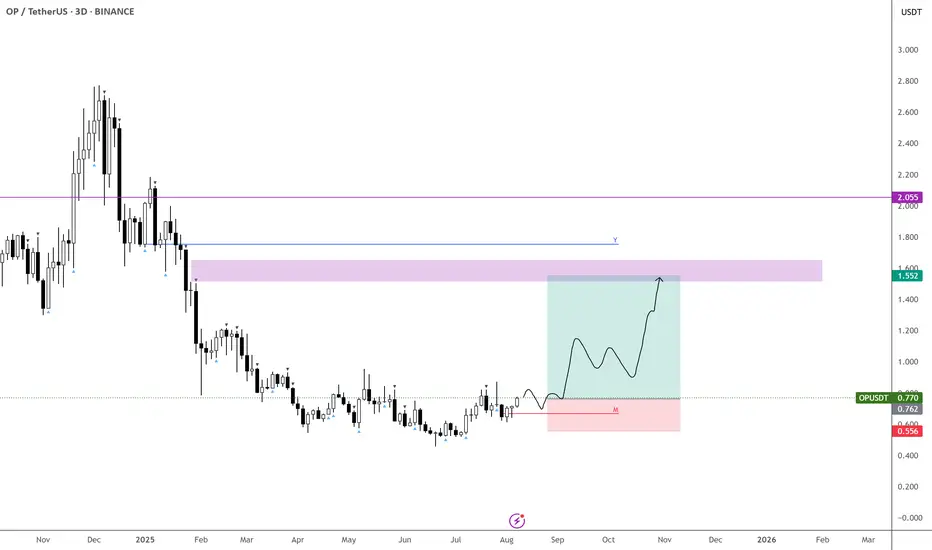
$OP – One to Keep in the Basket
Liking the structure here — the 3day chart is on the verge of triggering a bullish signal, so I’m getting in early with some buys here.
If price dips into $0.66 or $0.55, I’ll be adding more.
Targeting the FVG just below the yearly open for this move. BINANCE:OPUSDT
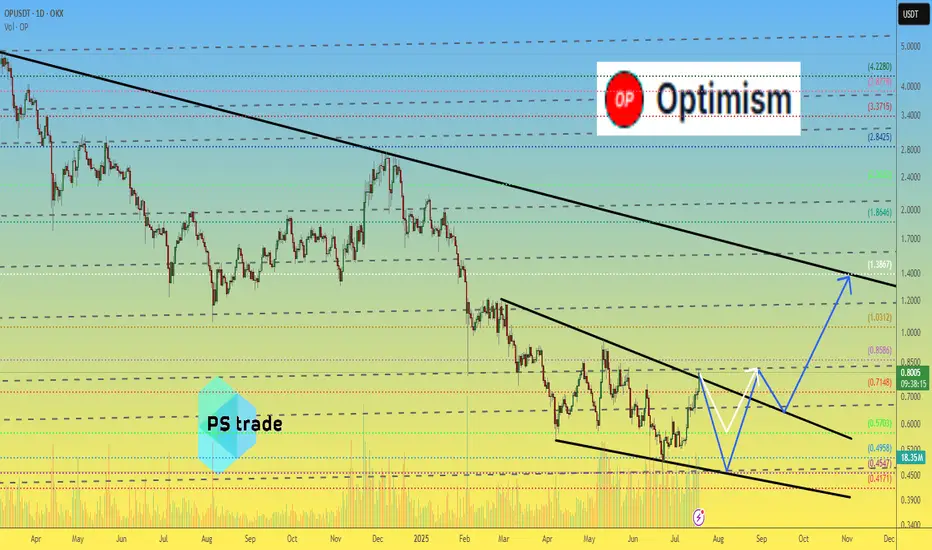
OP - Chance for +70%After weekly close we can see the volume coming in. On the chart we have resistance which if we break through then we can expect price 1.4 which is +70% from now.
If I have some advice for leverage trading I think its better to wait for daily close and then hunt retest if happens.
Rotations of money started already and I don't think is it a case for long run. We need to act, take profit and watch something else.
Like if you like analysis and idea.
Ivan

Optimism Op price analysis - be careful After the listing of #OP on the Korean exchange, known for its "pump events", we observe a surge in volume along with a breakout from the downtrend.
🐻 The current 6-hour candle on OKX:OPUSDT is attempting to form a pin bar — a potential reversal signal.
⚠️ High volumes often indicate the final phase of a move. Such pumps are usually short-lived — proceed with caution.
👌 Our previously published medium-term forecast for #Optimism remains relevant
________________
📚 Follow us ❤️ for daily crypto insights & updates!
🚀 Don’t miss out on important market moves!


Buy Trade Strategy for OP: Driving Ethereum Layer-2 ScalabilityDescription:
This trading idea focuses on OP, the native token of Optimism, a leading Ethereum Layer-2 scaling solution designed to significantly reduce transaction fees and increase throughput. By utilizing optimistic rollups, OP enhances Ethereum’s performance while maintaining its security and decentralization. The token serves multiple purposes, including governance, ecosystem funding, and incentivizing network participation. With Ethereum’s network congestion and high gas fees driving demand for scalable solutions, Optimism’s growth potential positions OP as a strong contender in the Layer-2 race.
Still, the cryptocurrency market is highly volatile, and OP is not immune to sudden price swings caused by market sentiment, regulatory updates, or technological shifts. Proper risk management and awareness of potential challenges are essential for any investment in this asset.
Disclaimer:
This trading idea is for educational purposes only and does not constitute financial advice. Trading cryptocurrencies like OP carries substantial risk, including the possibility of losing your entire investment. Always conduct thorough research, assess your financial situation, and consult with a qualified financial advisor before making investment decisions. Past performance is not indicative of future results.


OPUSDT Maintains Bearish MomentumOPUSDT continues its decline following the breakdown from a massive rising wedge. After a clean corrective pullback, price formed a bearish continuation structure, which has now broken into a descending channel guiding the current move.
The chart suggests further downside toward the projected drop target, which aligns with a potential re-accumulation zone for long-term positioning.
Keep an eye on price behavior as it approaches this level for possible reversal signals.

Optimism OP price analysisCurrently, the price of #OP does not look very optimistic (a little pun to start with )))
🟢 An optimistic forecast would be for the price of OKX:OPUSDT to rise to $1.40
🟡 But it looks like this growth will not happen now, but after a correction.
🔴 Correction: only to $0.57 or again to $0.45 — this is also an open question.
👌 Patience to holders and fans of the #Optimism project, the “microclimate” in the crypto market is improving — the time will come, and this coin will also be pumping...
_____________________
Did you like our analysis? Leave a comment, like, and follow to get more
1d OP - Long setupToday I set up a low lev (2x) long with a 7:1 rr on BINANCE:OPUSDT
Reason being that it seems to have bottomed out. fairly close to the VAL and POC. both are at 50 cent and 55 cent respectively. I'd consider adding a little margin IF it comes close to that area. around 48/49 cents I'd consider myself out. my target is 4.50, possibly 78.6 fib at around 4 dollars I'll take some out, but the past ATH of 4.50 should be possible imho.
currently the marketcap is at roughly over 1 billion. to shoot it towards 10 billion is not a big stretch.
currently it followed a downtrend since the last ATH in march 24. possible reaction/rejection once more around that touchpoint. with enough volume and the correct sentiment in the market, I see it push through and retest before going towards VAH at 2.06 and the 50% fib at 2.66.
all things considered, I'll take the chance.

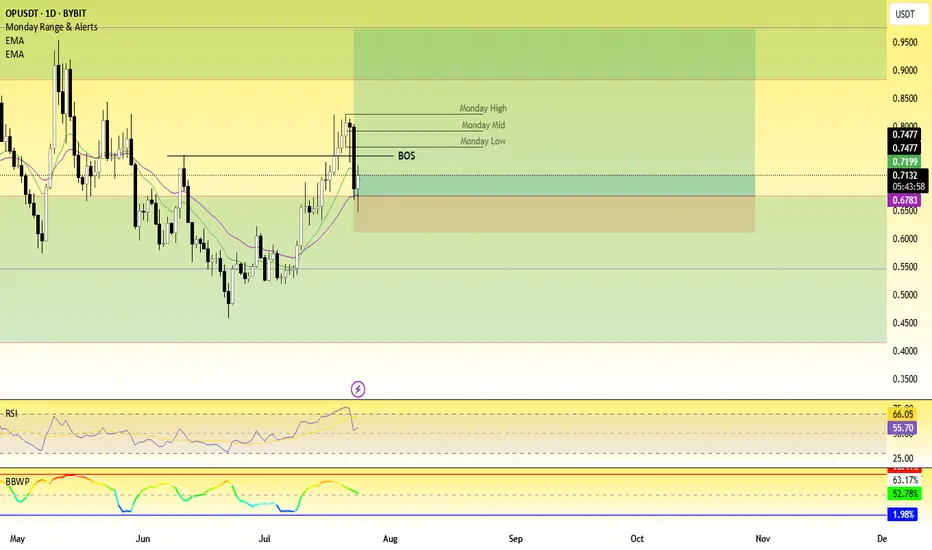
OPUSDT Update
Symbol: OP/USDT
Timeframe: Daily
Chart Analysis:
The price is currently approaching a key resistance zone at around 0.673, as seen in the chart. A descending trendline from May to June has been acting as resistance. The price has recently made a strong move towards this resistance zone, showing a potential breakout pattern.
If the price successfully breaks above the 0.673 resistance, we could see a bullish continuation towards the next resistance levels, potentially up to 0.700 or higher. The breakout would suggest a reversal of the prior downtrend.
Key Levels:
* Resistance: 0.673 (current resistance zone)
* Support: 0.600 (lower support area)
Trade Strategy:
1. Long Entry: Consider entering a long position if the price breaks above the 0.673 resistance with strong volume.
2. Target: A reasonable target could be the 0.700 region. Keep an eye on price action as it approaches this level.
3. Stop Loss: Place a stop loss below the 0.600 support to manage risk in case of a failed breakout.
Risk-Reward: A potential reward-to-risk ratio of 2:1 or better, depending on entry and exit points.
Conclusion:
Monitor the price closely for a breakout above the 0.673 level. If it breaks and sustains, a bullish move could follow. Watch for volume confirmation and market momentum to gauge the strength of the breakout.

1d OP (short idea)currently BINANCE:OPUSDT looks very bottomed out, approaching a key downward resistance in the next days. if the volume picks up, and the sentiment is there - I think it will pick up quite well.
OPUSDT // During the time we stay on the green line, the direction is up. The first target is Fibo 1.414, which is 0.680, the main target is 0.768. Cut losses below the green line.

OPUSDT Forming Falling ChannelOPUSDT is currently exhibiting a promising setup that could lead to a significant bullish move. The chart shows that the price has broken out of a well-defined falling channel pattern, which often signals the end of a correction phase and the beginning of a potential uptrend. With the breakout confirmed and good volume supporting this move, there is a strong possibility of a 90% to 100% gain in the coming sessions, drawing the attention of traders looking for breakout plays.
Optimism (OP) has been a hot topic within the crypto community due to its role in scaling Ethereum through its layer 2 solution. The consistent development and growing adoption of the Optimism network have sparked investor interest, providing a fundamental backdrop that complements the bullish technical signals. Many traders see this breakout as an opportunity to get in early on a potential recovery rally.
The current price action suggests that OPUSDT may continue its upward trajectory if buying pressure remains strong and key resistance levels are cleared convincingly. Traders should watch for sustained volume spikes and possible retests of the breakout level, which can offer more confidence in the continuation of the bullish momentum. As always, risk management is essential when navigating such moves.
✅ Show your support by hitting the like button and
✅ Leaving a comment below! (What is You opinion about this Coin)
Your feedback and engagement keep me inspired to share more insightful market analysis with you!

OPUSDT 1D#OP is on the verge of breaking out above the descending resistance and the SMA50 on the daily chart. The setup looks promising — keep a close eye on it.
In case of a breakout, the targets are:
🎯 $0.647
🎯 $0.706
🎯 $0.764
🎯 $0.848
🎯 $0.954
⚠️ As always, use a tight stop-loss and apply proper risk management.

Optimism Extreme BUY: Easy 1277% Profits Potential—Can Go HigherOptimism is now moving within a "extreme BUY" zone. This is a price zone that was active only once between June and July 2022, one month only and then OPUSDT went on a massive rally. Total growth amounting to more than 1,111% from bottom to top.
This zone has been activated again for a little over one month and I believe it won't remain valid much longer. There is room for a new wave of growth but this time much more than 1,111%.
The target shown on the chart is a good one but I believe this trading pair/Cryptocurrency project can go higher when all is said and done.
Technical analysis —Bullish based on price action
On the 16-June week, 22-June specifically, Optimism (OPUSDT) hit its lowest price yet. 0.457. This is just a bit higher compared to the all-time low June 2022 at 0.396. We can easily say the bottom is in as this week the action is back above its 7-April 2025 low.
Higher targets
The next high target sits at $12, giving us a 2,078% potential for profits from current price. 0.551 at the time of writing.
Previous cycle vs current cycle
Optimism's first bullish cycle lasted 630 days. The next cycle, the one that is about to start now, can last an entire year, eight months... We are entering uncharted territory so it is hard to say.
One thing I can say based on TA is that this new wave will be much more steep compared to the last one. The climb will be really fast, it will be hard to adapt.
How to trade to maximize profits
The best way to approach this pair for sure success is by buying when prices are low, now. This would secure a smooth ride and happy profits on the way up.
If you are reading this now, your timing is awesome because we are looking at a bottom catch, this type of opportunity is only seen once every several years. For example, the last time OPUSDT traded this low was in mid-2022, three years ago. Once the bullish wave takes off, there is no going back. Once the bulls are in, low prices will be forever gone.
Thanks a lot for your continued support.
Namaste.

OPUSDT: Buyers try to regain control inside the rangeHi traders and investors!
On the daily timeframe, OPUSDT is trading in a sideways range. The price has repeatedly dipped below the lower boundary at 0.545, but each time, buyers managed to bring it back.
Now, we’re seeing another attempt to return into the consolidation zone — a possible sign of renewed buyer initiative.
If the price secures above 0.545, the path opens toward the next targets at 0.844 and 0.954. However, a short-term dip below 0.52 may occur within this bullish scenario.
Therefore, buying becomes a priority once the price is firmly back above 0.545.
This analysis is based on the Initiative Analysis concept (IA).
Wishing you profitable trades!

OP 5$ SOONOptimism
Optimism is an EVM-compatible optimistic rollup blockchain platform built on top of Ethereum.
We note that the currency has been undergoing a deep correction for a long time due to the ongoing downward pressure and market negativity.
Note that the currency made a strong rebound after a false break on the RSI.
I expect this currency to achieve a historic high once the currency season begins.
This analysis fails to break the historic low and trade below it.
I wish everyone abundant profits.
Like and follow
for more.

OPUSDT Forming Descending ChannelOPUSDT is showing an impressive technical setup that has caught the attention of many crypto traders recently. The chart reflects a well-formed descending channel, which is a classic bullish reversal pattern when broken to the upside. Currently, the price action is testing the upper boundary of this channel with increasing buying pressure, signaling that a potential breakout could be on the horizon. A successful breakout here, supported by good volume, could trigger a strong rally in the coming sessions.
The volume profile for OPUSDT is encouraging, as it suggests that more investors are accumulating positions in anticipation of this move. This aligns with the optimistic sentiment in the broader crypto market, where traders are actively seeking altcoins with high potential upside. With an expected gain of around 80% to 90%+, OPUSDT offers an attractive risk-to-reward ratio, especially for those who prefer swing trades and short-term position trades in trending altcoins.
One key factor to watch is whether OPUSDT can sustain momentum above the descending channel’s resistance line. If volume remains strong and the breakout confirms on higher timeframes like the daily or weekly chart, this could attract further interest from both retail and institutional traders. Such a move often sparks a chain reaction of buying, as traders look to ride the trend to its projected target zone.
Overall, the combination of a textbook pattern, healthy volume, and increasing investor interest makes OPUSDT one to watch closely. Keep it on your radar for a possible breakout play with significant upside potential. As always, manage your risk properly and wait for a confirmed breakout before entering any position.
✅ Show your support by hitting the like button and
✅ Leaving a comment below! (What is You opinion about this Coin)
Your feedback and engagement keep me inspired to share more insightful market analysis with you!

