OP/USDT Break Alert! It shows will retesting before continue UP!💎 Paradisers, #OP is indeed a coin worth monitoring closely.
💎 It's currently poised for a potential retest of the LTF demand zone around $2.47 after encountering resistance at the OB- area around $3.04. Notably, the chart already indicates a breakout from the descending channel, which is a positive sign.
💎 If OP successfully bounces from the LTF demand area, it could signal upward movement, contingent upon breaking through the OB- area to reach our next target strong resistance zone.
💎 However, if OP fails to bounce from the demand zone and breaks below it, we might see continued downward movement with a retracement to the support area. The last time OP reached the support area around $2, it exhibited significant bouncing and recovery, suggesting a similar pattern could unfold if it revisits this level.
💎 The bullish invalidation would be confirmed if OP fails to bounce at the support and the daily candle closes below the $1.86 support area. In such a scenario, the price would revert to a bearish trend and continue downward.
MyCryptoParadise
iFeel the success🌴
OPUSDT trade ideas

OPUSDTmy entry on this trade idea is taken from a point of interest BELW an inducement.. I extended my stoploss area to cover for the whole swing as price can target the liquidity there before going as i anticipate.. just a trade idea, not financial advise

OPTIMISM (OP)Optimism (OP) is a layer-2 scaling solution for Ethereum that focuses on enhancing transaction speeds and reducing costs through Optimistic Rollups. This method offers a significant boost in throughput and efficiency for developers building on Ethereum, making it a critical player in the blockchain scalability arena.
Given the continued importance of scalability for Ethereum and Optimism's effective technology, the next price targets for OP might realistically be set at $3.20, $4.00, and $7.00. Traders considering this bullish context may wish to engage now. This trading suggestion is based on Optimism's robust role in expanding Ethereum's capabilities and the general bullish trend in demand for layer-2 solutions.

OP 05/05/2024OP is struggling to reenter our range above. We are currently at discount area. Even if we give a big pullback towards diagonal, we should be thinking to buy not sell at the moment.

OP Mega Bullish OP is looking very bullish. Because its swing structure was shifted and now we are looking for good entry after confirmation of internal structure shift. As we can see a clear CHoCH that is why I am looking to build long position around trendline retest and aslo there is my faviourite Fibb. level as well. A perfact setup according to my system, What are your thoughts?

OPUSDTmy entry on this trade idea is taken from a point of interest BELOW an inducement.. I extended my stoploss area to cover for the whole swing as price can target the liquidity there before going as i anticipate.. just a trade idea, not financial advise

📈Analyzing OP: Fundamentals and Technical Outlook💎🔍Today, we delve into the analysis of Optimism (OP) coin, a leading project in Ethereum Layer 2 solutions. Being one of the earliest and most reputable Layer 2 solutions, Optimism has garnered significant attention, particularly from DeFi enthusiasts, due to its substantially lower transaction fees compared to Ethereum. This has allowed users with limited capital to participate in DeFi and reap profits, further boosting its popularity within the crypto community.
📰Fundamentally, Optimism has demonstrated its potential with a daily trading volume of $500 million across 38 markets. Now, let's shift our focus to the technical aspects. Nearly a year since its listing on Binance, Optimism reached its all-time high (ATH) of $4.865 in early 2024. Presently, after a corrective phase, it has found support around $1.8 and currently resides at approximately $2.77. The next significant resistance lies at $2.943, with expectations high for its eventual breach.
📈The weekly timeframe indicates an upward trend, despite a recent selloff candlestick accompanied by significant volume, suggesting the possibility of further upward movement if green volumes begin to increase. However, persistent selling volumes and the SMA25 acting as resistance, particularly aligning with the $2.943 level, present a formidable barrier that could impede price action.
🛒In the event of further correction, a buying opportunity may arise in the range of $1.97 to $2.3, but it's advisable to exercise patience and wait for candlestick confirmation before entering the market. Subsequently, lower timeframes such as the daily can provide additional confirmation for our buy signal.
✅Our initial target is set at the ATH, with further targets to be identified upon consolidation above this level, utilizing Fibonacci extensions to pinpoint higher targets and resistances. Regarding the RSI, maintaining support at 41.7 is crucial to avoid potential heavy bearish pressure on the coin.
📝In conclusion, Optimism (OP) coin presents a compelling opportunity for traders, supported by both fundamental strengths and promising technical indicators. Traders are advised to exercise caution, await confirmation signals, and implement effective risk management strategies to navigate the market successfully.

OPUSDT LONGLong trade idea for OP USDT after a clear break of structure, the market is moving back to take off the liquidity void reaching the fvg & OB. I believe the trend is only up, DYOR!!

OP:b-b-e📊Analysis by AhmadArz:
🔍Entry: 2.487
🛑Stop Loss: 2.145
🎯Take Profit: 2.88 - .3.299 - 3.586
🔗"Uncover new opportunities in the world of cryptocurrencies with AhmadArz.
💡Join us on TradingView and expand your investment knowledge with our five years of experience in financial markets."
🚀Please boost and💬 comment to share your thoughts with us!

OPUSDTmy entry on this trade idea is taken from a point of interest BELOW an inducement.. I extended my stoploss area to cover for the whole swing as price can target the liquidity there before going as i anticipate.. just a trade idea, not financial advise

OPUSDT(Optimism) Daily tf Range Updated till 02-05-24OPUSDT(Optimism) Daily timeframe range. its trying to get over 2.849. getting over 2.849 will open a level till 4.021. but that require volume and there are effects of btc PA. local retrace point is at 1.879.


Optimism OP price has been moving in its own "special way"Today, NASDAQ:OP #Optimism has attracted attention because it is not falling in line with CRYPTOCAP:BTC and other altcoins.
In fact, for the past two weeks, the #OPUSDT price has been moving in its own "special way".
Perhaps there is already some fundamental news ready for this price movement, do you know anything? Share in the comments.
The critical level below is $2.30. If buyers hold on, then theoretically, the OP price could start to rise dynamically.
Up to $3.40, or maybe even $4.40, or maybe even higher) Let's wait and see)
_____________________
Did you like our analysis? Leave a comment, like, and follow to get more

OP TokenThe Optimism price retested its strong support mark of $2 and hovered in the bearish trajectory.
OP - Enjoy The Ride 🚗Hello TradingView Family / Fellow Traders. This is Richard, also known as theSignalyst.
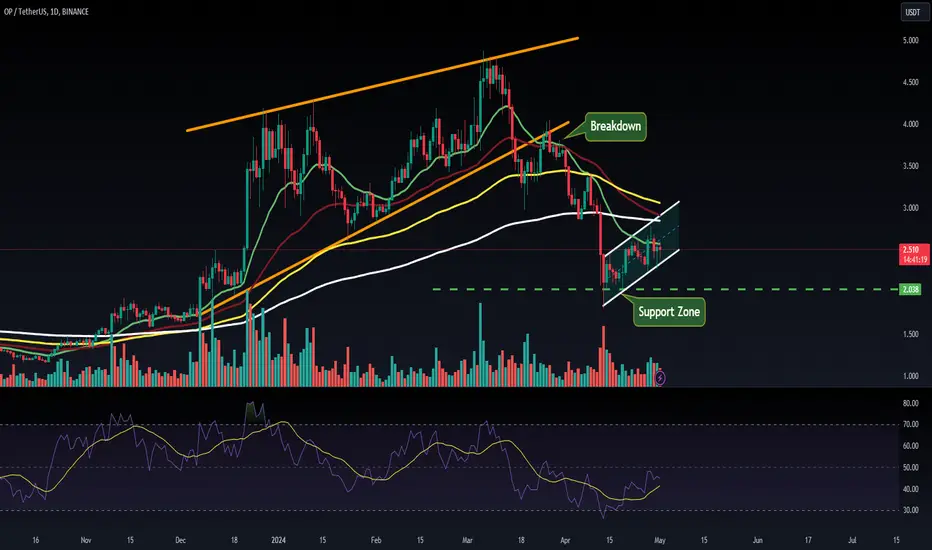
📈 OP has been overall bullish, trading within the rising broadening wedge pattern in red.
Currently, OP is undergoing a correction phase and it is currently approaching the lower red trendline.
Moreover, it is retesting a strong support zone marked in blue.
🏹 Thus, the highlighted blue circle is a strong area to look for buy setups as it is the intersection of the blue support and lower red trendline acting as a non-horizontal support.
📚 As per my trading style:
As #OP approaches the blue circle zone, I will be looking for bullish reversal setups (like a double bottom pattern, trendline break , and so on...)
📚 Always follow your trading plan regarding entry, risk management, and trade management.
Good luck!
All Strategies Are Good; If Managed Properly!
~Rich

#OP/USDT breaks Diagonal Trendline heading towards a FVG in 30-M#OP/USDT breaks Diagonal Trendline heading towards a FVG in 30-Minut TF!
I'm opening a long position with tight stop loss and entries are around that FVG.

OP ANALYSIS🚀#OP Analysis : Breakout and Retest
🔮As we can see in the chart of #OP that there is a perfect breakout of trendline and retesting the trendline in 4he time frame. This indicates a potential bullish move.📈📈
🔰Current Price: $2.438
🎯 Target Price: $4.793
⚡️What to do ?
👀Keep an eye on #OP price action. We can trade according to the chart and make some profits⚡️⚡️
#OP #Cryptocurrency #TechnicalAnalysis #DYOR


OPUSDTOPUSDT was trading under the declining trendline. The price was reacting well the support and resistance of trendline
Currently the price has given the breakout from declining trendline with confluence to strong bullish divergence and now seems like the bulls are getting ready for some strong upside movement.
If the bulls sustain to upside the optimum target could be 4
What you guys think of this idea?

OP Short PositionOP Short Position
. Rejection From RESISTANCE ZONE 2.8
. Bearish Market Ahead : 30 April ... FOMC Meeting & Binance founder faces possible three-year jail term
Stop Loss : 2.81(9.6%)
Entry : 2.565
TP: 1.8 ( 33%)

OPUSD 1WOP ~ 1W 📈
#OP We will start making purchases gradually when retesting this support line. This is our first purchase. with a minimum target of 20%+

