OPUSDT trade ideas

OP Weekly Price ActionOptimism (OP) is currently at a critical support level of $3. On the hourly timeframe, OP is showing a steep downward trend, indicating a bearish trajectory. While oscillators show a neutral stance on the daily and weekly charts, moving averages signal a significant sell-off.
Optimism stands to benefit from Ethereum's Dencun Upgrade, which has notably reduced gas fees. Therefore, the current downturn could be attributed to routine profit-taking and panic selling.
Taking a broader perspective on the weekly view, Optimism is forming a megaphone chart pattern. A reversal from the current support level could drive it to new all-time highs (above $4.5) in the next bullish phase. Monthly analysis of oscillators and moving averages strongly suggests buying opportunities. If Optimism is in your portfolio, consider accumulating during dips.

OP long setup hello Traders, here is the full analysis for this pair, let me know in the comment section below if you have any questions, the entry will be taken only if all rules of the strategies will be satisfied. I suggest you keep this pair on your watchlist and see if the rules of your strategy are satisfied. Please also refer to the Important Risk Notice linked below.

Op Short Result.The result of My Short on Op I took a few days ago. I predicted the fall few days back and the result was massive.
Although judging from the price action as at today it is seeming I took profit a little early [haha'
anyways will wait for a trend break or massive continuation before entering another trade.

OPUSDT S/R Flip TestingThe #OPUSDT pair has dropped to the S/R flip area. This zone should be closely monitored.
Take your risk, make some profit.

OP updateI haven't been doing much except Bitcoin shitposting lately :D Knowing the market was at least crippled for some time. I'm serious about Bitcoin but it can do bullshit ranging for so long you'd be surprised.
Now I wanna share my opinion about OP. Since I'm bullish on ETH I guess I should be bullish on some ETH L2s.
Generally I like OP chart. I'd be happy to see 3.3 holds in the very near term.

OP long setup hello Traders, here is the full analysis for this pair, let me know in the comment section below if you have any questions, the entry will be taken only if all rules of the strategies will be satisfied. I suggest you keep this pair on your watchlist and see if the rules of your strategy are satisfied. Please also refer to the Important Risk Notice linked below.

Long OPUSDTLooks like retesting the support, will shoot up if it holds the support. Please check next 4H candle for confirmation. Good Bullish Pattern.

Optimistic about $OPIf there is a crypto bull run in 2024 and the price channel holds, I foresee positive developments for $OP.
Invalidated if channel is broken.

$OP On the way to a Grand Slam break out and new ATHNASDAQ:OP golden cross done with almost only 18% correction which is very bullish in my opinion. Daily moves indicates strong probability to resume upward momentum and big chance to make new ATH the soonest in my opinion.
Not financial advise and DYOR!!!

Optimism (OP) || R/R = 3:1Optimism (OP) is a layer 2 scaling solution for Ethereum that aims to increase the scalability, speed, and affordability of Ethereum transactions while maintaining security and smart contract compatibility. It utilizes a technology called Optimistic Rollups to achieve these goals.
News:
The Block || February will see $800 million of unlocks from Avalanche, Optimism, Aptos, and more.

Optimism To The Moon🩸 NASDAQ:OP #Optimism (OP/USDT) (March 12, 2024) (#OP, #Spot)
In 2024, Optimism continues to play a significant role in the Ethereum ecosystem as a Layer 2 optimistic rollup solution, emphasizing scalability and efficiency. With a total funding amount of $178.5 million, Optimism has attracted the interest of notable investors and companies, underscoring its potential in the blockchain space.
Optimism's growth has been fueled by strategic partnerships and upgrades, enhancing the network's appeal to developers and users alike. This focus on network efficiency and expanded utility positions Optimism for potential growth amid a broader market adoption of Layer 2 solutions. Optimism has seen a notable rise in its ecosystem, making it an attractive option for investors looking for promising cryptocurrency projects in the run-up to a potential 2024 bull market.
Tokenomics-wise, Optimism boasts a market cap of over $1.2 billion, with a total supply of approximately 4.3 billion tokens and an inflation rate of 2%. The distribution of these tokens is strategically allocated across retroactive public goods funding, investors, core contributors, the ecosystem fund, and airdrops. This allocation strategy underlines Optimism's commitment to both its community and its technological infrastructure.
🕵️ Investors (Tier 1,2):
a16z (Andreessen Horowitz), IDEO CoLab Ventures, Paradigm
As the crypto landscape continues to evolve, Optimism's developments and its role within the Ethereum scaling solution space signify the dynamic nature of the market, offering promising avenues for both developers and investors.
🟢 Entry price: $4.38
🟢 Take Profit 1: $8.76 (50%)
🟢 Take Profit 2: $18.80 (10%)
🟢 Take Profit 3: $23.50 (10%)
🟢 Take Profit 4: $28.20 (10%)
🟢 Take Profit 5: $32.90 (10%)
🟢 Take Profit 6: $37.60 (10%)

OPUSD Fibonacci Profit targetOPUSD perform a nice bullish, and already have a small correction.
We have buy range at $4.284 - $3.889 to follow bullish wave and aim for fibonacci -0.382 AKA 1.618 at $5.281
Good luck

OP FRACTALS: 10$ is nearFractal patterns are recurring patterns that appear at different scales on a chart. They can be used to identify potential support and resistance levels, as well as trend reversals. This article will analyze the OP/USDT chart using fractals and other technical indicators to identify potential trading opportunities.
Fractal Analysis:
Ascending Channel: OP/USDT has been trading in an ascending channel since its listing on Binance. The channel is characterized by a series of higher highs and higher lows.
Triangle Patterns: Within the ascending channel, OP/USDT has formed several triangle patterns. These patterns are often seen as consolidation periods before a breakout.
Accumulation Patterns: OP/USDT has also formed various accumulation patterns, such as bull flags and pennants. These patterns suggest that buyers are accumulating the coin in preparation for a bullish move.
Orderflow Analysis:
Sweep Liquidity: OP/USDT has exhibited instances of sweep liquidity, where large buy orders quickly push the price up, absorbing all the available sell orders. This indicates strong buying pressure.
Order Book Analysis: The order book shows the distribution of buy and sell orders at different price levels. By analyzing the order book, traders can identify potential areas of support and resistance.
Trading Opportunities:
Breakouts: Traders can look for potential breakout opportunities when OP/USDT approaches the upper or lower boundary of the ascending channel.
Retracements: After a breakout, traders can look for retracement opportunities to enter a trade in the direction of the breakout.
Support and Resistance: Traders can use the identified support and resistance levels to enter long or short positions.
Conclusion:
Fractal analysis and orderflow analysis can provide valuable insights into the potential price movements of OP/USDT. By identifying these patterns and understanding the underlying market forces, traders can make more informed trading decisions.

Optimism Offloads $90M Worth of Tokens in Private DealThe Optimism Foundation has made headlines with its recent private sale of governance tokens, sparking discussions within the Ethereum community. Let's delve into the details of this significant transaction, analyzing its implications, transparency, and the varied responses it has garnered.
Unveiling the Sale:
The Optimism Foundation ( NASDAQ:OP ), stewards of the Ethereum layer-2 blockchain, recently announced a private sale of approximately 19.5 million of its governance tokens. Valued at around $90 million, this move signifies a strategic decision by the organization to manage its token treasury effectively.
Understanding the Vesting Period:
Central to the sale is a two-year vesting period imposed on the buyer, preventing immediate token liquidation. This mechanism aims to maintain stability within the ecosystem while enabling governance participation for the purchaser. Such measures underscore the foundation's commitment to responsible token distribution and long-term sustainability.
Transparency and Community Discourse:
While the sale was conducted privately, it sparked debates within the Ethereum community regarding transparency and governance practices. Ethereum advocate Anthony Sassano expressed concerns over the lack of transparency, highlighting the importance of open communication in fostering trust. However, others defended the foundation's actions, acknowledging the necessity for sustainable funding and operational viability.
Strategic Asset Allocation:
The sale draws from the "unallocated portion" of the NASDAQ:OP token treasury, constituting 30% of the initial token supply. This strategic allocation reflects the foundation's prudent management of resources to support ongoing development initiatives and ecosystem growth.
Lessons from Past Transactions:
This isn't the first time Optimism has engaged in a private token sale. A similar transaction occurred in September 2023, raising $160 million, albeit with similar concerns raised within the community. However, the adherence to a two-year lockup period mitigated immediate market impacts, emphasizing the importance of structured token release strategies.
Conclusion:
As the Ethereum ecosystem continues to evolve, governance token sales play a pivotal role in shaping the trajectory of projects like Optimism ( NASDAQ:OP ). While debates surrounding transparency and strategic asset management persist, the foundation's commitment to long-term sustainability and ecosystem development remains unwavering. Moving forward, open dialogue and collaborative decision-making will be key in navigating the complexities of token economics and community governance in the blockchain space.

OP Coin Technical Analysis: Weekly and Daily TimeframesIntroduction
OP is the native token of the Optimism PBC Layer 2 scaling solution for the Ethereum blockchain. It is a governance token that allows holders to participate in the protocol's governance process. OP launched in May 2022 and quickly gained traction due to its association with Optimism, a popular scaling solution.
Weekly Timeframe Analysis
After listing, OP experienced three bearish candles, followed by a 92-week bullish trend.
This strong uptrend indicates the coin's strength and momentum.
Daily Timeframe Analysis
OP has recently undergone a trend reversal following a mid-term downtrend.
A powerful breakout from the $2.965-$3.947 range led to new all-time highs (ATHs).
There is a potential for further bullish movements in the future.
Important Considerations
Entering a long position at this time may not be the most prudent strategy.
A more cautious approach would be to wait for a pullback and then enter at an opportune moment.
Entering with a wide stop-loss also carries significant risk, but there is a chance of reaching target prices.
Conclusion
OP exhibits a strong bullish trend on both the weekly and daily timeframes.
The coin has the potential to continue its uptrend in the future.
Enter positions cautiously and with a clear understanding of the associated risks.
Similar Coins
Other Layer 2 scaling tokens such as Polygon's MATIC and Arbitrum's One (ONE) share similar characteristics with OP.
These coins all aim to address scalability issues on the Ethereum blockchain.
Disclaimer
This analysis is for informational purposes only and should not be considered investment advice. Always conduct your own research before making any investment decisions.

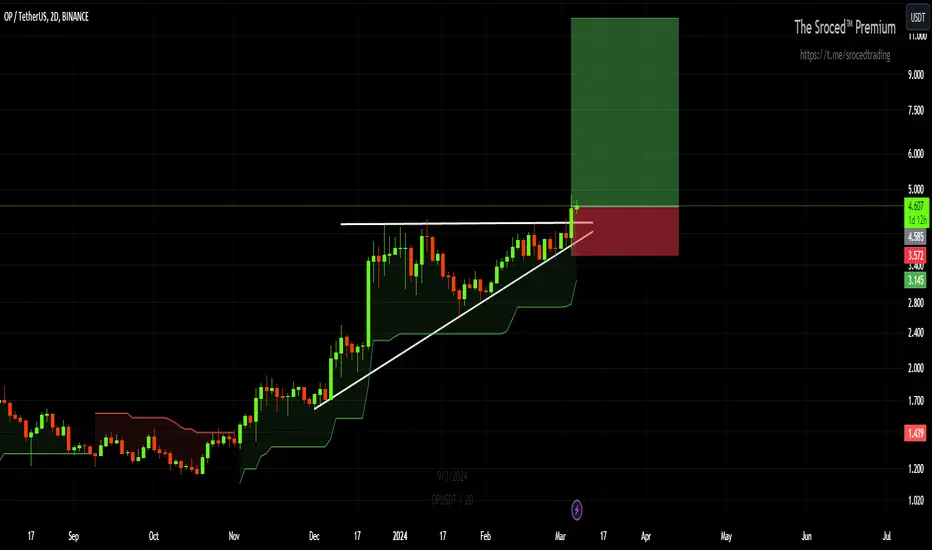
#OP/USDT confirmed breakout Ascending Triangle for Long entry!OP/USDT The identified pattern is an ascending triangle, which indicates an upcoming bullish uptrend. This suggests the potential for a significant price increase, potentially reaching as high as $12.
#OP/USDT LONG ENTRY
Leverage: 1x
Entries: $4.585
Take profit 1: $5.784
Take profit 2: $7.300
Take profit 3: $12.056
Stop Loss: $3.572
BINANCE:OPUSDT
NOTE: This is just my prediction. Be sure to use STOPLOSS and remember that I am not a financial adviser. your money, your risk!
Thanks
The sroced.
OP UpdateThis analysis is an update of the analysis that you can see at the bottom of this page, in the related analysis section
The diametric analysis of the previous analysis is still valid with one difference that the e wave is extended
Wave E appears to be an ascending zigzag.
It can continue to climb by maintaining the green lines.
Closing a daily candle below the invalidation level will violate the analysis
For risk management, please don't forget stop loss and capital management
When we reach the first target, save some profit and then change the stop to entry
Comment if you have any questions
Thank You

Be Aware if Wyckoff Theory!!!Read the chart and you will understand and remember Together we Make the Market!!!

OPUSDT IDEAUPDATE
The breakout of the Ascending triangle pattern has already occurred within the 1Week timeframe✅
Seems Like Ready For Massive Bullish Wave📈
COIN DETAIL
Optimism price today is $ 3.75 with a 24-hour trading volume of $ 785.72M, market cap of $ 805.31M, and market dominance of 0.04%. The OP price decreased -6.76% in the last 24 hours.

OP Breakout Signals Continuation of Bullish TrendTechnical analysis of OP indicates a bullish breakout from an ascending triangle pattern with strong volume. The Ichimoku cloud and MACD indicator also support a bullish continuation.
Disclaimer: This is not financial advice. Always do your own research before investing.

OPtimus 3524Looks ready to crack some fresh highs. Pay attention to what rebounds immediately and is up on a down day for BTC. these are the assets you want to really be in at least for a trade.
6 will come quick

Quick Bitcoin UpdateHello Traders,
Hope you enjoyed the downfall in BTC and once again we have posted exact levels of reversal.
If you like our analysis them please follow us and boost us
