OPUSDT Elliott Waves (Local Setup)Hello friends.
Please support my work by clicking the LIKE button👍(If you liked). Also i will appreciate for ur activity. Thank you!
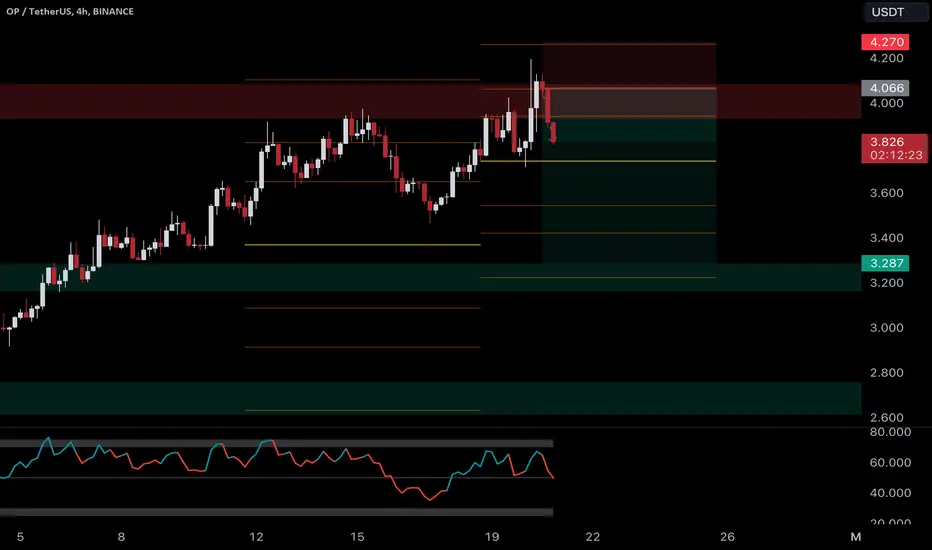
Everything on the chart.
Entry: Market and lower
Targets: 4.4 - 4.6 - 4.8
after first target reached move ur stop in breakeven
Stop: ~3.3 (depending of ur risk).
RR: 1 to 2
ALWAYS follow ur RM.
risk is justified
Good luck everyone!
Follow me on TRADINGView, if you don't want to miss my next analysis or signals.
It's not financial advice.
Dont Forget, always make your own research before to trade my ideas!
Open to any questions and suggestions
OPUSDT trade ideas

OP is bullishThe main structure and substructure are bullish and an important ceiling has just been broken
By maintaining demand, we expect to move to supply.
Closing a daily candle below the invalidation level will violate the analysis
Note that the financial market is risky, so:
Do not enter any position without confirmation and trigger.
Do not enter a position without setting a stop.
Do not enter a position without capital management.
When we reach the first TP, save some profit and try to move the stop continuously in the direction of your profit.
If you have any comments please post them, comments will help us improve our performance
Thanks

OP after the pullback will continue to go upOP after the pullback will continue to go up
🔵Entry Zone 4.088 - 4.264
🔴SL 3.917
🟢TP1 4.685
🟢TP2 5.419
🟢TP3 7.065
Risk Warning
Trading Forex, CFDs, Crypto, Futures, and Stocks involve a risk of loss. Please consider carefully if such trading is appropriate for you. Past performance is not indicative of future results.
If you liked our ideas, please support us with your likes 👍 and comments.

OP/USDT In an Unchartered Territory | 👀🚀What's Next for Op?💎Paradisers, let's take a closer look at #OPUSDT, showcasing vibrant market movements within an ascending channel framework.
💎At this moment, #Optimism is advancing towards the ascending resistance, starting from the demand zone. This scenario sets the stage for a potential price rebound from this area, aiming for an upward journey with the bearish Order Block (OB) as its forthcoming destination.
💎However, should NASDAQ:OP not manage to rebound and instead descends below the demand zone, it might see a fallback to the Bullish OB vicinity around the $3.13 mark, where it would seek rejuvenated drive for an ascent.
💎The Bullish OB zone has historically been a pivotal area for triggering significant market recoveries upon interaction. Yet, a compromise of this zone, indicating a shift towards bearish trends, may lead to a continuation of bullish momentum from a lower standpoint.
💎In case #OP doesn't leverage the momentum from this or any subsequent level, a persistent decline might ensue. Rest assured, Paradisers, your ParadiseTeam is vigilantly monitoring these shifts, ready to navigate you through these intricate market dynamics.

OPTIMISM TO $7BULL MARKET PHASE ON
OPtimism is breaking out of ascending trinagle with a bullish. buy signal
Target in chart
ETF approval for EThereum should help this narrative


OPUSDT----> LONG(a Super Pump Coming)Hi Guys!
BINANCE:OPUSDT is one of the best in the market in terms of technical and fundamental aspects , and I know it's going to be the next BINANCE:SOLUSDT in the upcoming bullrun!
It looks like we will have a chance here to buy with a reward/risk of 10 if the yellow line broken and I personally wouldn't miss this opportunity if it happens .
Entry
above 1.5$ level
TP
Short-term 1.8$- 2.8$
Mid-term $3.5$- 5.5$
Long-term 7.5$ 10$
SL
under 1.3$ Level
What you guys think about $Optimism ?

OP Price Analysis: Bulls Eyeing $5.049 BreakoutOP (OP) is currently facing resistance at the top of its daily channel. The bulls are looking to break above this resistance level, which could open the door to a rally towards $5.049.
Strong technicals: OP's moving averages (MAs) are trending bullish, with the 50-day MA crossing above the 200-day MA. The relative strength index (RSI) is also in bullish territory, above 70.
Positive market sentiment: The Fear & Greed Index is currently in "Extreme Greed" territory, indicating that investors are bullish on cryptocurrencies.
Upcoming catalysts: OP is scheduled to launch its OP Games Store on March 8, which could boost demand for the token.
Potential Risks:
The bulls are in control of OP, and the technicals are pointing to further upside. A breakout above the daily channel could trigger a parabolic rally towards $5.049. However, investors should be aware of the risks of Bitcoin volatility and profit-taking.
Disclaimer: This is not financial advice. Please do your own research before investing.


OP after breaking above the range bound will continue to go upOP after breaking above the range bound will continue to go up
🔵Entry Zone 3.710 - 3.855
🔴SL 03.409
🟢TP1 4.168
🟢TP2 5.904
🟢TP3 6.515
Risk Warning
Trading Forex, CFDs, Crypto, Futures, and Stocks involve a risk of loss. Please consider carefully if such trading is appropriate for you. Past performance is not indicative of future results.
If you liked our ideas, please support us with your likes 👍 and comments.

OPUSDTHi guys
Our support areas have been well maintained so far. But note that our resistance areas are also reserved.
It seems that we can enter into an attractive selling deal relative to the $4.033 range, provided that the $4.285 resistance zone is maintained.
What do you think?

Optimism $3.80 ➥ First target $10-$12Optimism $3.80 ➥ First target $10-$12
Entry price: $3.80
Stop Loss: $3.7065
First target $10-$12

OP Daily Chart AnalysisOP Daily Chart Analysis
Idea is clear in chart fundamentally major unlock of this token also
dump dump dump boost

OP - Breakout waiting to happenBINANCE:OPUSDT (1DH CHART) Technical Analysis Update
OP is currently trading at $3.777 and showing overall bullish sentiment and waiting to breakout from the resistance zone.
Breakout from the resistance zone will definitely fuel to bull run of the OP. OP is also one of the fundamentally strong coin so we cannot go wrong with the LONG entry for this coin while we wait for bull run continue.
Entry level: $ 4.292 (candle close above this)
Stop loss level: $ 3.697
Target 1: $ 4.597
Target 2: $ 5.061
Target 3: $ 5.571
Target 4: $ 6.610
Target 5: 6.792
Max Leverage: 2x
Don't forget to keep stop loss.
Follow Our TradingView Account for More Technical Analysis Updates, | Like, Share and Comment Your thoughts.
Cheers
GreenCrypto

Rejection or Breakout for OP/USDT ? BINANCE:OPUSDT (4H CHART) Technical Analysis Update
OP is currently trading at $ and currently price is at the resistance line
We can expect price to either breakout from the resistance or get rejected from the resistance. We will enter trade based on whether price will get rejected or not.
LONG Trade Details (only after confirmed Breakout)
Entry level: $ 4.023
Stop loss level: $ 3.818
Target 1: $ 4.122
Target 2: $ 4.217
Target 3: $ 4.429
SHORT Trade Details (only after confirmed Rejection
Entry level: $ 3.818
Stop loss level: $ 3.978
Target 1: $3.723
Target 2: $3.623
Target 3: $3.458
Max Leverage: 5x
Stay tuned for updates on breakout or rejection.
Don't forget to keep stop loss.
Follow Our TradingView Account for More Technical Analysis Updates, | Like, Share and Comment Your thoughts.
Cheers
GreenCrypto

$opusdt ready for 2Xhello guys
if it gives our entry price, most probably will go for 2X
entry and Tp prices on the chart. dont miss it.

OPTIMISMIf you found this analysis helpful or support my work, consider making a donation via Binance Pay: 57841095
Thank you for your support! 🙏💰
Optimism Daily TF Elliot WaveIt looks like OP is on its way to Wave 5 of Wave 1 of Wave 3.
It would be a good opportunity to trade this and exit at Wave 5 then wait till the cycle ends before longing again (Wave 2 of Wave 3).

opusdt 1D (It is still moving on the trend line)Hello friends, I hope you are doing well, you can see the OP chart in the daily time frame. If the support zone is maintained, it can grow well in the medium term

Opusdt trading opportunityThe OPUSDT trading pair is currently navigating within an ascending channel formation, indicative of a bullish scenario.
We have identified and established a proximal buy back zone, which is anticipated to be advantageous for initiating long positions. It is our assessment that this level will maintain its relevance over the short to medium term.
Additionally, we have delineated a price objective for the final setup. We invite you to share your perspectives on this chart and kindly remind you to express your support by liking our analysis.
Thank you.

$OP #Optimism Trading IdeaOP Optimism formed a potential double-top pattern after a second rejection at the same level as the previous one. Breaking down through this neckline can indicate a potential movement to the downside. Also, the volume is decreasing.

#TOBTC #LQR #OP these important support are painted on chart
in next correction Wave you may have a plan for those spot
DYOR !

Alikze → #OP | Pullback to broken resistance In time h1, after the failure of the resistance, which has now turned into support, and in dealing with the dynamic trigger, which has had a positive reaction several times and caused the price to grow. Now it is approaching the dynamic trigger as well as the support area. Therefore, if the current area encounters a reversal candle, it will have the ability to grow to the next supply and resistance area.
In addition, if the range of the green box is broken, at least correction up to 3.50 can be imagined.
If the behavior and structure of the currency changes, the post will be updated.
🟩Sup: 3.70
⛳️Tp 3.90
⛳️ Tp2 :3.95
⛳️ Tp3 : 4.10
-----------------
Please support this idea with a LIKE and COMMENT if you find it useful and Click "Follow" on our profile if you'd like these trade ideas delivered straight to your email in the future.
Thanks for your continued support.
Sincerely.❤️
