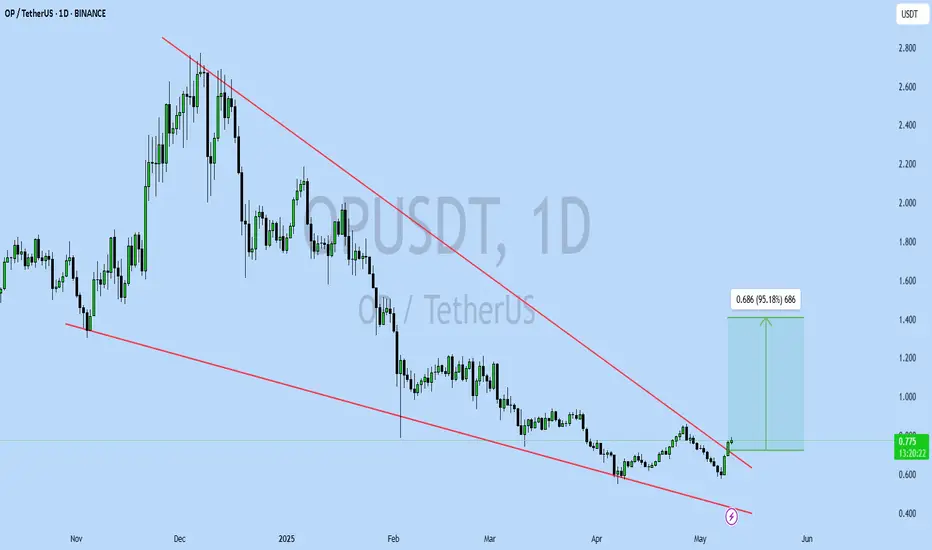
OPUSDT UPDATE
Pattern: Falling Wedge Breakout
Current Price: \$0.776
Target Price: \$1.46
Target % Gain: 95.18%
Technical Analysis: OP has broken out of a long-term falling wedge on the 1D chart, confirming bullish momentum. Breakout is supported by a clear volume spike and strong candle close above resistance.
Time Frame: 1D
Risk Management Tip: Always use proper risk management.
OPUSDT trade ideas
OPUSDT | Long | Liquidity Sweep | (May 7, 2025)OPUSDT | Long | Liquidity Sweep + Bullish Structure | (May 7, 2025)
1️⃣ Short Insight Summary:
After a clean stop-loss hunt, OPUSDT is showing strong signs of accumulation. Liquidity has been swept, and buyers on spot are stepping in aggressively. We're now watching for a bullish follow-through.
2️⃣ Trade Parameters:
Bias: Long
Entry: Current zone after liquidity sweep and W formation confirmation
Stop Loss: 0.49
TP1: 0.915
TP2: 1.197
Final TP: 1.96
Letting it run: Open potential to the upside beyond 2.50 if momentum holds
3️⃣ Key Notes:
✅ Liquidity has been cleared below recent lows, which often signals a reversal.
✅ Open Interest is rising — fresh positions are entering.
✅ Spot CVD is diverging bullishly — showing aggressive buyers stepping in.
✅ Three W formations suggest solid bottoming structure forming.
❌ If price loses 0.49 again with strong volume, the setup becomes invalid.
4️⃣ Follow-up Note:
I'll continue to monitor OPUSDT and update if we get any major changes in structure or volume.
Please LIKE 👍, FOLLOW ✅, SHARE 🙌 and COMMENT ✍ if you enjoy this idea! Also share your ideas and charts in the comments section below! This is best way to keep it relevant, support us, keep the content here free and allow the idea to reach as many people as possible.
Disclaimer: This is not financial advice. Always conduct your own research. This content may include enhancements made using AI.

OPUSDT 1D AnalysisOP ~ 1D Analysis
#OP Buy after successfully penetrating this resistant line with a short -term target of at least 15%+ from here.

OPUSDT Long | Imbalance + Fib Zone ReactionOPUSDT Long | Imbalance + Fib Zone Reaction
BINANCE:OPUSDT Price tapped into the 0.705–0.716 demand zone with strong confluence:
🔹 Imbalance fill
🔹 0.618–0.79 Fib zone
🔹 Consolidation above support
Entry: 0.734
SL: 0.674
TP1: 0.854
TP2: 0.915
Clean structure. Holding as long as 0.674 holds.
#OPUSDT #Altcoins #LongSetup #CryptoTrading #Fibonacci #PriceAction


OPUSDT | Long Bias | Money Outflows| (April 2025)Optimism (OPUSDT) | Long Bias | Money Outflows + Bearish Context | (April 27, 2025)
1️⃣ Insight Summary:
Money is flowing out of OP/USDT, and the structure still looks weak. I'm favoring lower prices from here, and preparing to enter around key liquidity zones.
2️⃣ Trade Parameters:
Bias: Long
Entry Zone: Watching around 0.69 - 0.7 for potential entry
Stop Loss: Below key support or recent local highs after entry triggers
TP1: 0.855
TP2: 0.915
TP3 (Final Target): 0.998
3️⃣ Key Notes:
✅ Clear outflow of money based on flow indicators — confirming weakness.
✅ Structure continues to grind lower, respecting the bearish trend since March 2024.
✅ Large liquidity pools are sitting around these levels — expecting price to hunt liquidity before real movements.
✅ If Bitcoin correlates and rallies, we might see a small bounce, but the big picture remains bearish.
❌ Risk if Bitcoin strengthens sharply and drags OP upward temporarily — always stay flexible but respect the larger downtrend.
4️⃣ Follow-up:
I will keep monitoring price action around the 0.920–0.937 zone and update if we either confirm the entry or if conditions change.
Please LIKE 👍, FOLLOW ✅, SHARE 🙌 and COMMENT ✍ if you enjoy this idea! Also share your ideas and charts in the comments section below! This is best way to keep it relevant, support us, keep the content here free and allow the idea to reach as many people as possible.
Disclaimer: This is not financial advice. Always conduct your own research. This content may include enhancements made using AI.

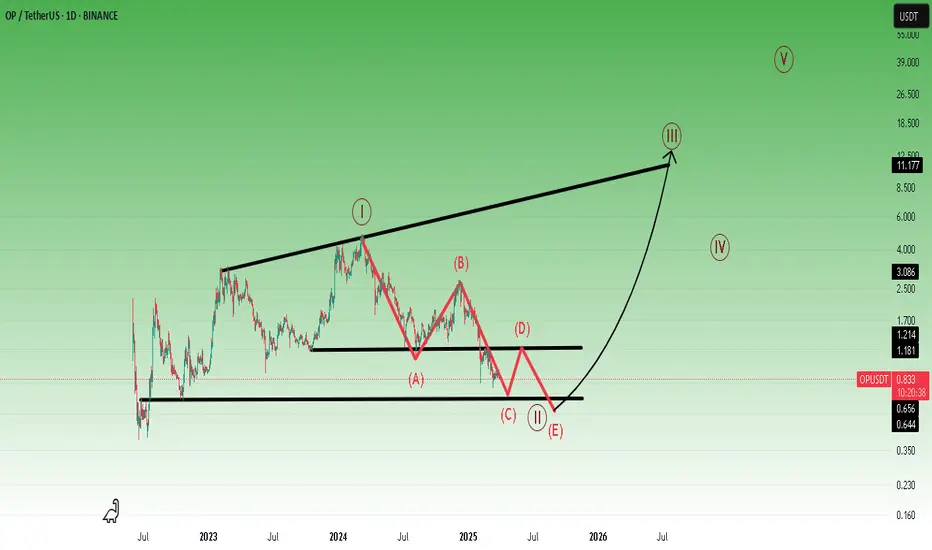
Optimism Back Above Long-Term Support: Easy 480% PPI will base this entire analysis on a single signal, a break and recovery of support.
Optimism moved recently below its previous All-Time Low established October 2022. The break below this level only lasted a few days. A week closed below and immediately the next week a close happened above. This is a bullish signal. Support was tested and holds. It broke briefly but the fact that the action is back above it makes this situation a bullish one.
» As long as OPUSDT trades above 0.636, market conditions are strongly bullish.
This week we have a full green candle and the week closes today. This is a continuation of last week that closed at the top of the session, another bullish signal.
Some Altcoins are now producing three digits green in a single day, real projects. This type of action is only present in a bullish cycle. At the beginning of a bullish wave, in-between or at the top, never within a bearish cycle or bearish wave.
Bullish action is confirmed. Bullish reversal is confirmed. Higher prices will happen next.
» I have an easy target for you mapped on the chart for OPUSDT, 480%.
Thank you for reading.
There will be more... This target on the chart is only the start, we are set to experience growth long-term. You have not seen how the Altcoins market looks and feels when it grows for six months straight, it will be awesome, and then the bull run.
Namaste.

OPUSDT 3D AnalysisOP ~ 3D Analysis
#OP Buy gradually from here if you still have a Conviction on this coin with a short -term target of at least 15%+ from here.

OP Secondary trend. Wedge. Reversal zones. 17 04 2025From the wedge breakout, the price reached the level of 2.857 (81%) and from it the trend reversal under the general trend of altcoins, breaking through the "neck" zone of the head and shoulders, thereby realizing this pattern on a large scale and reaching the reversal zone of the minimums of the level of 0.509. We went down to the range below along the fan. Consolidation above the dynamic support opens up the potential for movement to its resistance, I specifically put another meridian, as from it with a high degree of probability, even with the implementation of the bullish potential, there will be a significant pump / dump rollback. It just intersects with the previous consolidation of support, which in this case acts as resistance (those who previously bought in this zone will sell, thereby going into breakeven and stimulating the stop of the impulse and a rollback (logical probability).
Locally, again having formed on the fall, as before, a descending wedge in the secondary trend. It has not yet been fully formed, the price is not clamped. But, conditionally, the price is at the minimum zone. You can start gaining from the average price, or work on a breakthrough of the formation, observing risk and money management. If you are scared (it is always like this at the minimum zone) - then everyone is the same, and most refuse to buy, but willingly buy when the price is already expensive.
A breakthrough of this wedge is a corrective upward movement to the mirror resistance zone of the previous consolidation (highlighted in gray), if in general, a "revival of faith" is observed in alts.
Also after breakout of the wedge, if the market as a whole is bearish on alts, then they will make a cut (in this case, a repeated set) at the zone of minimums in a wide range of price slippage and the complete death of faith in the candy wrapper of "crypto whales", highlighted in green.

OP/USDT Major trend. 07 2024Logarithm. Time Frame 1 week. After the listing there were 3 cyclical pumping of the “participation” phase. PR, hype, connection of the majority in mass media. The reversal occurred with a typical breakout in the secondary trend of a triangle (first pumping) or a wedge (second pumping). Now the third wedge is forming, the price is near the dynamic Gann support (reaction from it), but still in the range of the descending wedge pattern.
On a line chart (liquidity, no slippage) the declines are cyclical at -63% each time according to the algorithm. Each successive top +55% of the previous secondary trend.
It is quite possible that something similar will happen again this time (not necessarily), but only ideally after holding dynamic fan support and breaking wedge resistance. I have purposely shown only medium-term targets after a trend break.
Gann's trend fan is plotted on the chart, i.e. dynamic support/resistance areas for the future.
Optimism customization - L2's blockchain scaling solution ETH Crypto funds have invested a total of $267 million.
Secondary trend Time frame 3 days

OP/USDT Secondary trend. Wedge. Pivot zones. 27 07 2024OP/USDT Secondary trend. Wedge. Pivot zones. 27 07 2024
Logarithm. Time frame 3 days. A descending wedge is forming. The price is near the dynamic Gann support (reaction from it), but still in the range of the descending wedge pattern. The reaction in this resistance zone will determine the trend for the near future.
On the chart, I have specifically shown the minimum percentages of the two key reversal zones for the trend to local resistance levels, for the potential of option A and B.
Major trend.
OP/USDT Major trend. 07 2024 Time frame 1 week.

$OPUSDT Spot Accumulation Zone Analysis🔸
🔸 Key Support Zone at $0.45–$0.68:
Price has entered a strong historical demand zone, which has previously acted as a base for major rallies. Volume also shows buyer interest increasing near current levels.
🔸 Upside Target: $2.10 (Mid-Term)
Price projection based on historical reversals from this range. Once above $1.20, momentum can pick up quickly.
🔸 Risk Level at $0.329:
Invalidation below this level as it breaks below the accumulation structure. SL should be respected strictly.
🔸 Entries recommended:
Entry 1: $0.684 (30%)
Entry 2: $0.55 (30%)
Entry 3: $0.45 (40%)
🎯 Targets:
TP1: $0.78
TP2: $0.95
TP3: $1.20
TP4: $1.60
TP5: $2.10
💎 HODL Target: $3 – $5 for long-term investors based on projected recovery wave and cycle pattern.
⚠️ Stoploss: $0.329

OP on the rise!NASDAQ:OP
Optimism is building a Superchain to scale Ethereum!🔗
#OP has been overall bearish in the long term, trading within the falling channel marked in orange.
For the bulls to shift the trend from bearish to bullish, a break above the last major high at $0.675 is essential.🚀

I am very optimistic about Optimisim in the long term.But first, let's go a little deeper.
* What i share here is not an investment advice. Please do your own research before investing in any asset.
* Never take my personal opinions as investment advice, you may lose all your money.
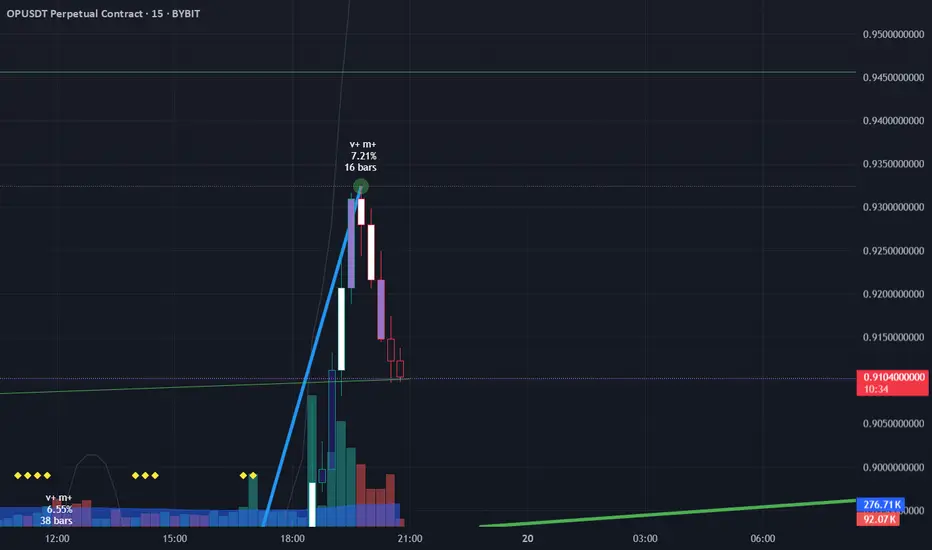
LONG OP OP rise more than others in my bookmarks
HIgh volumes and moves.
Porbably target end in dayly SAR - 0,948
DO YOU BUY ASSETS USING DCA LIKE THIS?DO YOU BUY ASSETS USING DCA LIKE THIS?
First, you can see that OP (case study) entered a downtrend after hitting its peak on the monthly (M) timeframe around the $4 price zone.
Uptrend period: from 2022 to 2024
Downtrend period: from 2024 to now (no clear sign of the decline stopping or accumulation yet)
With a DCA (Dollar-Cost Averaging) strategy, you’d definitely be buying on the right side of the chart, meaning the price decline zone. "No buying in the red, so what’s there to sell in the green?" This means that during the price drop, you’d use certain tools to "justify buying," like a trendline forming during the decline, a support level below, or on-chain data showing buyers starting to dominate, and so on.
And surely, you’d end up buying a lot in the $1.6–$2.3 range because that’s where you’d see those "solid" signals you thought of earlier. Unfortunately, the price kept dropping below $1, then $0.9, and now it’s at $0.7… and it’s still going lower. At this point, you’ve run out of funds to keep DCA-ing into OP.
Have you ever stopped to ask yourself: Why is the price dropping like this? Where’s that "solid" trendline? Where’s the "strong" support? Where did all those buyers from the on-chain data go?
Now, let’s move to a hypothetical scenario:
First, let’s say you bought at the right price, like $0.7, and at this point, the price stops dropping.
But it’s not until 2027 that OP starts a new uptrend wave on the monthly (M) timeframe.
Condition (1) means you got the price right, but condition (2) hasn’t happened yet. Your asset might be at a good price, but the timing isn’t right. You’d have to hold this asset until 2027, as per this hypothetical situation, for it to actually turn a profit.
That means for the next two years, your capital just sits there quietly. Even if the broader market enters an uptrend, your asset stays flat.
So, you’re not losing in terms of asset value, but you’re losing in terms of opportunity cost—wasting time on it.
Whether this hypothetical scenario comes true or not, it’s just an illustration of how I’d approach this kind of problem for you all.
Read it, feel it, and share your thoughts if you find it helpful, okay?
Wishing you a peaceful weekend with your family!


OPUSDT 4DOP ~ 4D Analysis
#OP Place two purchases at this support level, with a short -term target of at least 20%+.
This is a key support that needs attention.

#OP/USDT#OP
The price is moving in a descending channel on the 1-hour frame and is adhering to it well and is heading to break it strongly upwards and retest it
We have a bounce from the lower limit of the descending channel, this support is at a price of 0.834
We have a downtrend on the RSI indicator that is about to be broken and retested, which supports the rise
We have a trend to stabilize above the moving average 100
Entry price 0.909
First target 0.939
Second target 0.992
Third target 1.054

#OP/USDT Analysis📉 NASDAQ:OP swept swing low liquidity and bounced hard, now holding the 4H IFVG.
🔹 Looking for a PDL sweep & a tap into the bottom 4H FVG before a bounce towards PWH $1.2163.
👀 Spotting long opportunities from here!

OPUSDT UPDATEOPUSDT is a cryptocurrency trading at $2.000. However, the target price is unusually lower at $0.600, which seems incorrect. Typically, a target price is higher than the current price. Assuming the target price is actually higher, the potential gain would be significant. The pattern is a Bullish Falling Wedge, a reversal pattern signaling a trend change. This pattern suggests the downward trend may be ending. A breakout from the wedge could lead to a strong upward move. The Bullish Falling Wedge is a positive signal, indicating a potential price surge. Investors are optimistic about OPUSDT's future performance. The current price may be a buying opportunity. Reaching the corrected target price would result in significant returns.

OPUSDT → There's still a chance for an alt seasonBINANCE:OPUSDT is showing positive momentum relative to what bitcoin has put up this night. The coin is in consolidation and testing trend resistance
The main reason for the lack of an altcoin season is bitcoin's huge dominance of the cryptocurrency market. The fall of BTC (open channel to 75K) and further growth after the formation of an intermediate bottom in the 75-80K zone may reduce the dominance phase, which in general will give a chance to the altcoin market, which is going through bad times.
I like OP in the fact that it is not falling in the wake of the flagship, but stands in consolidation, where we have clear boundaries for strategy formation. Focus on resistance: 1.212.
Resistance levels: 1.212
Support levels: 1.044, 0.983
Thus, a break of the resistance at 1.212 could trigger a rally and an attempt to change the trend.
It may happen after correction to 0.5 fibo, or after formation of pre-breakdown consolidation on H1-H4.
The structure of the setup will be broken if the coin starts to break 1.044-0.983.
Regards R. Linda!

what will OP look like in 2025?"Does OP have the other side?
Currently, OP is on the downward slope of the M cycle. Could the larger cycle allow OP’s chart to have the other side of the M?
If it does, then the bottom-catching zone is indeed below. If not, will it continue to move sideways (SW) and wait?
So, what will OP look like in 2025?"
