OPUSDTThis is a 1D frame analysis for OPUSDT As you can see, the price is moving in an upward channel and the price dropped slightly after hitting the support line, but was able to re-establish itself above the support line and we can see green candles. We expect the price to remain above the support line while fluctuating towards the resistance line.
OPUSDT trade ideas

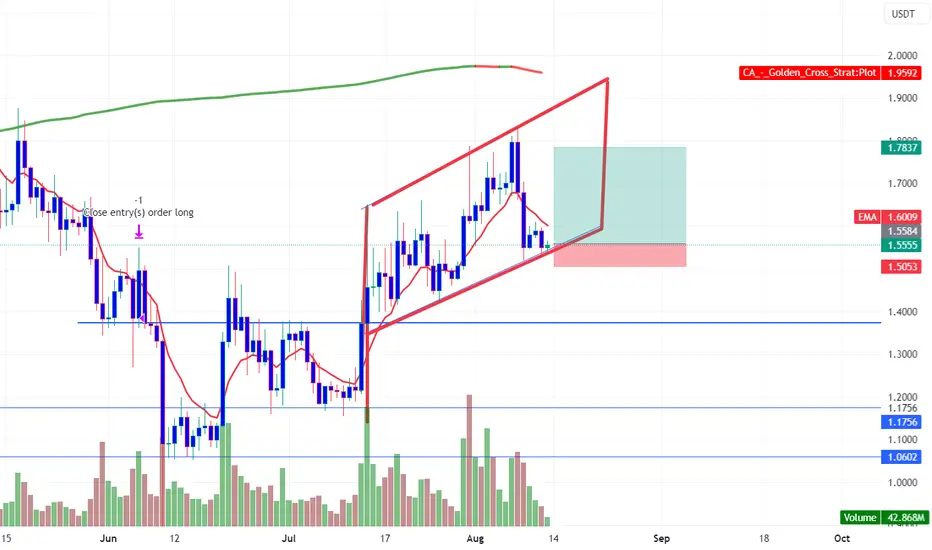
Three scenarios | Two good, One badDaily Chart
Now, BINANCE:OPUSDT is on ascending trend line acts the support in this situation.
I figure out 3 scenarios for OP now:
Number 1. Price will bounce back and going up resistance zones at 1.83
Number 2. Price will break down support and touch Hidden Support around 1.29 then consolidation phase long time before test resistance at 1.83
Number 3. Price down to 1.14 and sideway long time
So, wait and see what happen
I'll update

🔥 OP Parallel Channel Bounce: Looks Quite Bullish!OP saw an incredible start of 2023. Sadly, after a huge move early in the year, OP has been selling off for most of the months after the initial pump.
However, I see signs that the sell-off is done and that there's more bullishness coming soon, arguably even a new all-time high. Key component of this trade is the bottom support of the parallel channel (the top resistance is a direct copy of the support line)
For the best risk-reward I'm looking at a target of 6.00, potentially 3.00 if you're more risk averse. Stop at 1.2 which is just below the recent low.
In previous analyses I've mentioned that I see more bearish price action coming to BTC, so this trade could function as a hedge. OP is arguably one of the better looking alts at the moment with a lot of potential upside.

OPUSDTOP is forming a Symmetrical triangle..
Recently the price has retraced the bit of bearish move and now the instrument is trading at broken support which being act as a support. There are more chances that price will fall from this resistance area.
What you guys think of this idea ?

OP/USDT Downward Momentum ??? Optimism Today AnalysisHello Paradisers, spotlight on this token!
💎 OP bounced after touching the Bullish OB zone and managed to close above the support trendline of its bearish flag.
💎There's potential for OP to rise, possibly to test the supply zone, before a subsequent decline. The anticipated downward movement might lead OP to revisit the previous wick area, which is closely aligned with a robust demand zone. This area could witness significant buying activity if OP reaches it.
💎For those considering short positions, the supply zones between 1.52 - 1.6 could be ideal, with a stop loss set above the recent high. It's worth noting that on 28th August, there's a token unlock event for OP. Historically, prices tend to rise leading up to such events, only to experience a drop on an actual day.
💎This makes it highly plausible for OP to touch the accumulation buy zone post-unlock.

#OP/USDT - Long - Potential 12.48%DIRECTION: LONG
MARKET: SPOT
RISK: 0.25% - 1%
#USDT_OP
EXCHANGE: BINANCE
TIMEFRAME: 360
ENTRY: 1.522
TP1: 1.712
STOP: 1.330
Entry Triggers:
| RVD break from an oversold position
Currently testing the 20&50 EMAs - enter on the break


OP short - swing trade OP retested the highs of its current range and giving us some bearish pa for the time being. Looking to short towards 1.20$
Scaled in 3 positions between 1.45$ and 1.50$ (avg entry 1.46$). Tight stops resting above the current highs capping the market. Stops can be adjusted if deemed necessary and according to your risk.
Expecting us to drop in the FVG sitting around 1.40$.
IF we get a clean break and hold above 1.50$ I will look to reduce and close my positions.
Entry market (aggressive) / Entry below 1.46$ (conservative)
TP 1.40$
TP 1.35$
TP 1.20$
SL 1.54$ above current highs capping the market 1.54$
Stay safe and never risk more than 1-5% of your capital per trade. The following analysis is merely a price action based analysis and does not constitute financial advice.

OPUSDT Falling Wedge and False Breakout!OPUSDT s currently exhibiting a Falling Wedge pattern. The Falling Wedge is a bullish chart pattern that typically indicates a potential trend reversal from a downtrend to an uptrend. The pattern is formed by connecting the lower highs and lower lows with two converging trendlines, creating a wedge-like shape.
One notable characteristic of the Falling Wedge is that it often experiences false breakouts. A false breakout occurs when the price briefly moves beyond one of the trendlines but quickly reverses back into the wedge pattern, trapping traders who entered positions based on the breakout signal.
As per Plancton's rules, traders are paying close attention to the current price action as the market tests the key level at $1.6. This level is crucial because it could act as a potential resistance within the Falling Wedge pattern.
If the price manages to break out decisively above the $1.6 level, it would be considered a breakout signal according to Plancton's rules. This breakout to the upside would confirm the validity of the Falling Wedge pattern and potentially trigger a new uptrend for OPUSDT.
Based on Plancton's rules, a "new long" trade is suggested if the breakout occurs. A long position involves buying Opus with the expectation of a continued upward movement in price. Traders might place a stop-loss order below the recent swing low or the breakout level to protect against potential false breakouts or adverse price movements.
As for profit targets, traders can use various technical analysis tools to estimate potential upside price targets. Fibonacci extensions, previous resistance levels, or the height of the Falling Wedge pattern itself can be used to identify possible price objectives.
–––––
Follow the Shrimp 🦐
Keep in mind.
🟣 Purple structure -> Monthly structure.
🔴 Red structure -> Weekly structure.
🔵 Blue structure -> Daily structure.
🟡 Yellow structure -> 4h structure.
⚫️ Black structure -> <= 1h structure.
Follow the Shrimp 🦐

OP TO 1.9, SHALL WE HAVE IT Currently in an ascending wedge, I expect a test of that Order Block to send it higher to 1.9
Invalidation at 1.42
Set your alerts and take the trade
SEE YOU AT 1.9


OP has strong support levelAccording to the OP instrument, the trend is locally downtrend (this is noticeable by the hayes that have been declining over the past day). Trading volumes are also declining, and large sales orders are in the glass. The highs are not updated, but the price is pressed to the minimum. This indicates the strength of the seller and the weakness of the buyer. Against this background, a cascade of lows formed to break into the short of the round number 1.52, as well as a downward trend holding the price. To enter the transaction, I expect a smooth approach with trading above the levels and, as a result, an impulse breakdown downwards in order to take out liquidity beyond the levels

OP: Channel UpTrade setup : Trading in a Channel Up pattern. Trends are improving. We wait for a breakout, ideally with confirmation when price breaks above $1.80 resistance and 200-day Moving Average (~$1.97). Benefiting from the launch of Worldcoin (WLD), which is based on Optimism protocol.
Pattern : Price is trading in a Channel Up pattern. With complete patterns (i.e. a breakout) – initiate a trade when the price breaks through the channel’s trendlines, either on the upper or lower side. When this happens, the price can move rapidly in the direction of that breakout.
Trend : Uptrend on Medium-Term basis and Downtrend on Short- and Long-Term basis.
Momentum is Mixed as MACD Line is below MACD Signal Line (Bearish) but RSI ~ 50 (Neutral).
Support and Resistance : Nearest Support Zone is $1.50 (previous resistance), then $1.20. The nearest Resistance Zone is $1.80, then $2.80


OPUSDT SELL TRADE IDEA OPUSDT is making a Bearish Rectangle Pattern and no any Divergence.
Entry Sell Stop 1.516
Stop Loss 1.620
TP-1 1.425
TP-2 1.340
TP-3 1.217

OPUSDT In Bearish TrendOPUSDT is in Bearish Trend , There is no divergence created and Inverse cup and Handle occurred.

OPUSDT a bullish trading signalMACD rises above the signal line, the signal is bullish, suggesting that the price of the asset might experience upward momentum in 1h fram>

OPUSDTHello Traders,
As we can see that after a bearish trend OPUSDT comes to the support and we can expect a big bullish move from here as it is making bullish flag we can expect a big move from here.
OP / USDTWe have reached the end of the overall market converging pattern during the upward trend, and at the heart of it is a small pattern that can open sell positions to specified areas.

op low risk shortop has been fighting the breakdown but ultimatly i believe we have a target of 5% down from here with a tight half percent stoploss

Optimism OP/USD
Looking at the next 3-6 months, I anticipate the chance to purchase those low points, followed by accumulating spot positions at those favorable levels, if they materialize.
The strategy involves making a single trade, buying at a lower price and selling at a considerably higher price. The timeline for this process might extend over a period of around 12-18 months.
The key here is patience.

OPUSDT Hello Traders,
The current condition of the OPUSDT pair at its 4-hour support
you can long position.
but has not bounced back or retested the area.
there is potential to make a falling wedge but a lot of noise for this pair
Please add a comment and Positive feedback and
constructive criticism are important to authors and the
community.

#OP/USDT is testing the PDL $1.66and Trendline in 4-Hour TF!#OP/USDT is testing the PDL $1.66and Trendline in 4-Hour TF!
Wait for BO/retest to open short.
