LONGEP1: 2.55
EP2: 2.48
Stop : around 6.00%
It does not need much explanation, the dependence of entry and stop loss on trend lines only
OPUSDT trade ideas

OP try for another massive breakoutOP / USDT
Price try to repeat the last 2 massive breakouts in a similar pattern
Will history repeat itself again
#DIOR
Best of luck

OPUSDT - Buy Setup!!OPUSDT (1D Chart) Technical analysis
OPUSDT (1D Chart) Currently trading at $2.56
Buy level: Above $2.55
Stop loss: Below $2.15
TP1: $2.9
TP2: $3.25
TP3: $ 4
TP4: $ 5
Max Leverage 2x
Always keep Stop loss
Follow Our Tradingview Account for More Technical Analysis Updates, | Like, Share and Comment Your thoughts

OP NEW UPDATE Hi, dear traders. how are you ? Today we have a viewpoint to BUY/LONG the OP symbol.
For risk management, please don't forget stop loss and capital management
When we reach the first target, save some profit and then change the stop to entry
Comment if you have any questions
Thank You

OP Analysis updateFollowing the previous analysis, It seems that the resistance in 2.39$ is broken, We are now waiting for the price to stabilize above this area on the daily time frame.
If it happens, due to the growing of OP/BTC we will expect that price jump above 3.2$ in incoming days.
Good luck👊🏿

OP is trying to break its resistance👁️👁️Hello traders🖐🏿
OP is trying to break its resistance in 2.4$.
I think it can be accomplish this time, if this break happen, price grows to 2.64$, that is a key resistance, because 2.64$ is level of upper edge off symmetrical triangle that formed in last weeks.
The break of 2.64$ will start a bullrun till 4.2$ as a new ATH.
Now the momentum of price movement is very good, and its a good sign to break the resistance.
In another hand we should keep our eyes to ETH chart, if ETH can break 2000$, the road to 4.2$ is clear.
Its not a financial advice, its just my idea.
Good luck👊🏿

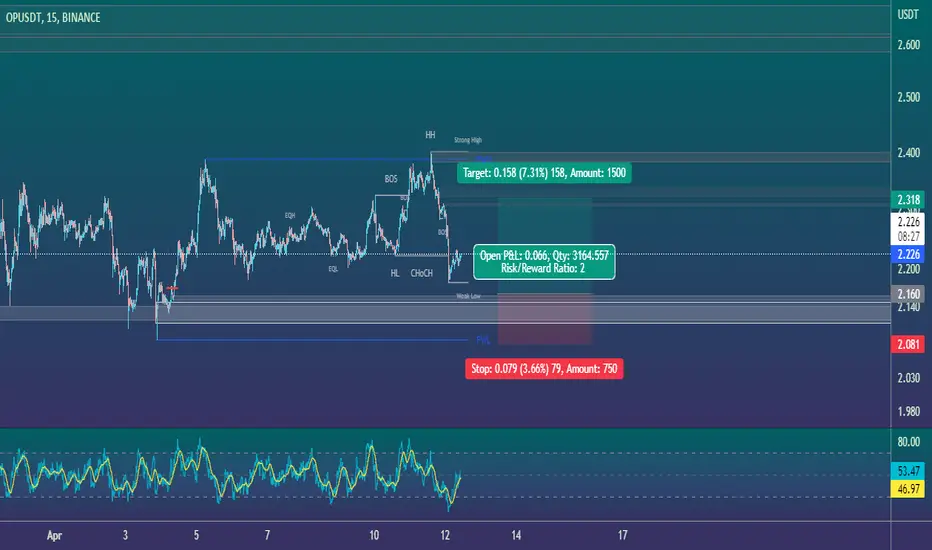
OP/USDT🔵🐇 #OP/USDT
🪄OP Position Based On Fresh Liquidity and Order Blocks and Structures
#Trade #eth #btc #bitcoin #ethereum #cryptocurrency #crypto #Trade #trading #Trader #Signal #forex #Scalp #altcoins #chart #RTM #ICT
@aliceinmoneyland

OPUSD ❕ liquidity zoneOP is moving in the liquidity zone.
The chart has formed an ascending bottom.
I think the asset will continue to grow.

OP/USDT🔵🐇 #OP/USDT
🪄 OP Scalp Position Based On Fresh Liquidity and Order Blocks and Structures
#op #Optimism #eth #btc #bitcoin #ethereum #cryptocurrency #crypto #Trade #trading #Trader #Signal #forex #Scalp #altcoins #chart #RTM #ICT
@aliceinmoneyland
OP trading inside an ascending channelOP trading inside an ascending channel
Keep eyes on it, along with BTC movement!

OP Looking for a Bullish BreakoutOP has consolidated since January and held price levels above the $2.00 price range. The following factors present the bullish case presented in the measured move:
- Falling Price with falling volume suggests a lack of bearish momentum
- Inverted Head and Shoulder pattern is one of the highest probability structures in trading with around a 90% success rate. Measured move is around the $3.50 range
- Falling wedge pattern has consolidated price nicely and signals for a bullish continuance. Measured move is $4.61
- Hidden Bullish Continuation divergence suggests the long time frame bullish trend is likely to continue.
- Weekly Stoch RSI has reset below 20 with price remaining high suggesting another move up is likely
- 3D Stoch RSI is pointing upwards. Likely to break downward trendline (Bullish) this week or early next week.
- Several bounces off 50% Fib level suggest strong support levels
Overall set-up for a 5x long with a price target of $4.61 suggests an upside of 481.7% and a stop loss around $1.975. Risk to reward of 6.11 on a high probability set-up.

OP LongOP Long on low time frame of 5 min and it is showing trend continuation with hidden bullish divergence on 3 mins

Optimism technical analysis, I think it's excellent Optimism After technical analysis, I think it's excellent for the near future long, not for the recommendation of course.
BINANCE:OPUSDT.P

Optimism for me .BINANCE:OPUSDT.P
Optimism After technical analysis, I think it's excellent for the near future long, not for the recommendation of course.

#OP long scalp#OP forming an ascending triangle on H4, once it clears the resistance zone here, next ideal zone would be $2.41 levels.

Opusdt Getting ready for breakout Opusdt
Formed Bullish Symmetrical Pattern & in 4h time frame Incase of breakout Expecting 20-40% Bullish Move
Candle : Morning dogi Star Candlestick pattern (Bullish)
Remember: These are just ideas that we share from our experience, it does not mean that they will be 100% perfect, anything can happen in the market at any time.
Always manage your risk and trade with your on research


FUTURES LONGSon one hand, this is a medium/high probability setup as price has retraced quite low during its uptrend so buying opportunities have come in place ..
on the other hand, on the lower time frames 30min-1hr, price is in a clear downtrend so it will require some sort of strength and volatility for the trend to reverse but its all a probability and my cards are longs right now.
lets see...

OP BULLISH !OP is at resistance..I have marked the horizontal red line..if OP closes daily candle above that horizontal line then it'll turn bullish.


Op Getting Ready For Another Bullish Move Seems Like getting ready for Another Bullish impulse
formed Bullish Pennant In daily timeframe Incase Of Breakout expecting Another 70 to 80% bullish move

OP ready to fly!After quite some downtrend and getting stuck in a triangle I expect the triangle to break downward which will most probably be a false breakout since it's an area of liquidity and start flying from the area that I highlighted which happens to be the entry price for the breakout signal!
NFA

OP will go up very soonThe price tested the uptrend, the second touch became the main signal to open a long position. In addition to the coincidence of the mirror level and the inclined one at this point. Additionally, the price is supported by a strong level of 2.1625, at which there are volumes to buy. High activity in a glass, with an additional density of 2.1838.
