OP/USDTKey Level Zone: 1.13200 - 1.13900
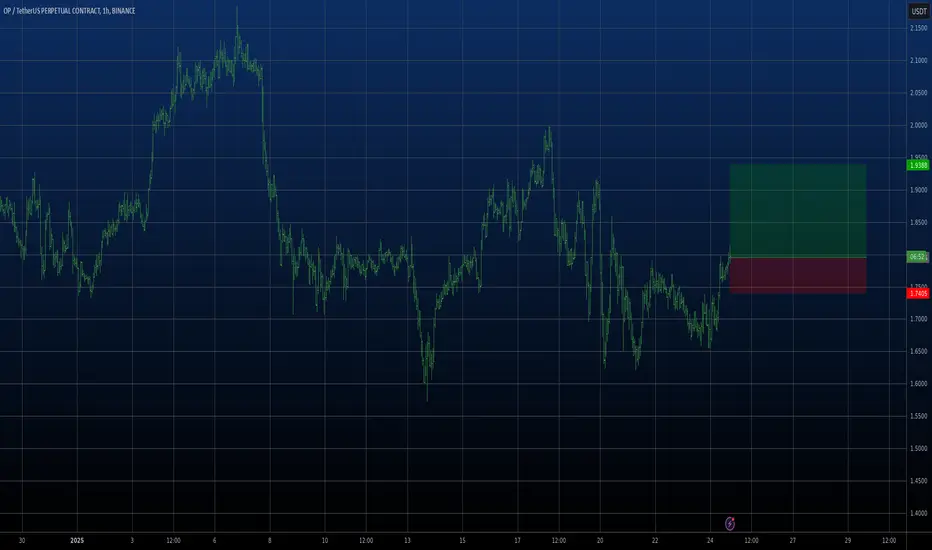
HMT v6 detected. The setup looks promising, supported by a previous upward/downward trend with increasing volume and momentum, presenting an excellent reward-to-risk opportunity.
HMT (High Momentum Trending):
HMT is based on trend, momentum, volume, and market structure across multiple timeframes. It highlights setups with strong potential for upward movement and higher rewards.
Whenever I spot a signal for my own trading, I’ll share it. Please note that conducting a comprehensive analysis on a single timeframe chart can be quite challenging and sometimes confusing. I appreciate your understanding of the effort involved.
Important Note :
Role of Key Levels:
- These zones are critical for analyzing price trends. If the key level zone holds, the price may continue trending in the expected direction. However, momentum may increase or decrease based on subsequent patterns.
- Breakouts: If the key level zone breaks, it signals a stop-out. For reversal traders, this presents an opportunity to consider switching direction, as the price often retests these zones, which may act as strong support-turned-resistance (or vice versa).
My Trading Rules
Risk Management
- Maximum risk per trade: 2.5%.
- Leverage: 5x.
Exit Strategy
Profit-Taking:
- Sell at least 70% on the 3rd wave up (LTF Wave 5).
- Typically, sell 50% during a high-volume spike.
- Adjust stop-loss to breakeven once the trade achieves a 1.5:1 reward-to-risk ratio.
- If the market shows signs of losing momentum or divergence, ill will exit at breakeven.
The market is highly dynamic and constantly changing. HMT signals and target profit (TP) levels are based on the current price and movement, but market conditions can shift instantly, so it is crucial to remain adaptable and follow the market's movement.
If you find this signal/analysis meaningful, kindly like and share it.
Thank you for your support~
Sharing this with love!
HMT v2.0:
- Major update to the Momentum indicator
- Reduced false signals from inaccurate momentum detection
- New screener with improved accuracy and fewer signals
HMT v3.0:
- Added liquidity factor to enhance trend continuation
- Improved potential for momentum-based plays
- Increased winning probability by reducing entries during peaks
HMT v3.1:
- Enhanced entry confirmation for improved reward-to-risk ratios
HMT v4.0:
- Incorporated buying and selling pressure in lower timeframes to enhance the probability of trending moves while optimizing entry timing and scaling
HMT v4.1:
- Enhanced take-profit (TP) target by incorporating market structure analysis
HMT v5 :
Date: 23/01/2025
- Refined wave analysis for trending conditions
- Incorporated lower timeframe (LTF) momentum to strengthen trend reliability
- Re-aligned and re-balanced entry conditions for improved accuracy
HMT v6 :
Date : 15/02/2025
- Integrated strong accumulation activity into in-depth wave analysis
OPUSDT trade ideas

Optimism Can Grow More Than 10X (~1180%)I've been always interested in this pair but something stopped me from taking the plunge. It was the chart structure. While it felt good and the potential was obvious, prices were too high and I knew a major correction was due before major growth.
Optimism (OPUSDT) looks different today.
The low that was hit very recently, 3-February, put prices at the same level as back in November 2022. The first bottom low after this pair started to trade.
OPUSDT hit a bottom in October 2022 and from this bottom grew to a high of some 666%. There was an initial b-wave corrected to a higher low and this higher low led to new a bullish-wave and then the major correction that ended earlier this month with a long-term higher low.
All gains have been removed. The long-term higher low opens the doors for a long-term higher high. This means a new All-Time High in 2025.
All the levels have been left visible on the chart. So you can choose what works for you.
We have more than 1,000% potential for growth being conservative. That's more than 10X.
Once the orange descending trendline is taken out, right side of the chart, we are in bullish territory. While the action happens within this trendline, the bullish bias is not confirmed.
It can take a few days just as it can take weeks for this condition to be met. This would be an irrelevant fact when we focus on the long-term.
For smart, long-term holders; buy and hold, the market will take care of the rest.
Your support is truly appreciated.
I'll be back soon with many more articles.
Thank you for reading.
Namaste.


OP, my notes for long-termwell, not much to say about this. I'm looking for this white and green lines and fib lines in the chart. And i think that prices are buying opportunities below that level.
not financial advices

OP / USDT: Gearing up for a breakout above Trendline resistance OP/USDT: Gearing Up for a Breakout Above Trendline Resistance
OP/USDT is shaping up for an exciting move 📈 as it approaches a critical trendline resistance zone 📊. The price has been consolidating tightly, creating the perfect setup for a potential breakout 💥. If the breakout happens, we could see a strong bullish trend unfold 🚀. Keep a close eye 👀 on this pair and wait for confirmation before acting.
Key insights:
1. Trendline resistance: OP/USDT is approaching a long-standing trendline that has previously acted as a barrier. A break above this could mark the start of a strong upward move.
2. Volume surge: Watch for a significant increase in trading volume during the breakout to confirm buyer strength 🔥.
3. Bullish signals: Momentum indicators like RSI and MACD are trending positively ⚡, supporting the case for a bullish breakout.
Steps to confirm the breakout:
Look for a clear 4H or daily candle closing above the trendline 📍.
A noticeable spike in volume during the breakout can signal strong buying activity 📊.
A retest of the broken resistance as a new support zone adds credibility to the move ✅.
Be cautious of fake breakouts, such as sharp reversals or wicks above the trendline ⚠️.
Risk management strategies:
Use stop-loss orders to manage your risk effectively 🔒.
Ensure position sizing aligns with your overall trading strategy 🎯.
This analysis is for educational purposes only and not financial advice. Always conduct your own research (DYOR) 🔍 before making investment decisions.

SHORT OP Days olumes been droped and 15 minutes volumes so small , looks like a dead cat jump formation
all predicted pumps are not succeded,
could be down squeeze

LONG OP it grow much fsater than others, jigh OI and and good reaction to fibo.
Probably nex candle going to be for gathering stops and then fast move opward

OP Low Resistance liquidity run ! First of all We have low resistance liquidity . we are expecting price to reach our mid term liquidity
In other hand if we run through that sibi that means we have strong bullish trend
Keep it simple just like that


OPUSDTVery high quality trade the stop is clear also the stop it is weekly fram so it will take some time

OP Spot Position (OP to break all time high??)OP USDT SPOT POSITION
This is the perfect chart.
We have a big ascending channel and we are on the lower part of it.
Requirements for SPOT position
We can wait for a retest inside the channel and then we buy spot position.
Or Buy now!
Buy at the Bottom and sell at the TOP is a must 🚀🤝
Targets
TP1 2.74 (Resistance Area)
TP2 4
TP3 5-7
SL Below recent low
This is a spot position so we don't care about leverage.
We dont panic sell in spot positions if we bought low!
Good luck!

OP/USDT Short Trade Setup Analysis (1D Timeframe - Binance)🔍 Market Context:
- OP/USDT has broken below an ascending trendline, indicating a potential trend reversal from bullish to bearish.
- The price is retesting the broken trendline as resistance, a common pattern before further downside movement.
- Recent price action has been bearish, forming lower highs and lower lows.
📊 Trade Entry Criteria:
- Entry aligns with a trendline retest rejection, signaling a failed attempt to reclaim the previous uptrend.
- Bearish price action confirms sellers stepping in at this level.
- The rejection is occurring near a previous support zone, which is now acting as resistance.
🎯 Trade Targets & Risk Management
- Entry Price: Around 1.412 - 1.487 USDT
- Stop Loss (SL): Above 1.596 USDT (above previous resistance)
- Take Profit (TP): 1.084 - 1.074 USDT (previous major support zone)
- Risk-to-Reward Ratio: Favorable short setup with R:R over 1:3
🛑 Stop-Loss Placement:
- Stop-loss is positioned above 1.596 USDT, ensuring protection against a fake breakout or bullish reversal.
📉 Profit Target Justification:
- The main target is the 1.084 - 1.074 USDT range, which aligns with a strong historical support level.
- If bearish momentum continues, a potential deeper drop toward 1.000 USDT could be possible.
📌 Summary
- Bearish breakdown below key trendline
- Retest rejection confirms sellers in control
- Clear risk-reward ratio (high probability short setup)
- Targets strong historical support levels for take profit
🔻 If price reclaims 1.596 USDT, the trade setup is invalidated, suggesting potential bullish recovery. Otherwise, continued downside is expected.

OP 4h - The last candleIf the last candle closes in a bearish breakout, %70 chance for a second leg down, if reverse, back to the previous high

$OP Testing Long-Term Support! NASDAQ:OP Testing Long-Term Support!
Optimism ( NASDAQ:OP ) is sitting on a major trendline support for over 600+ days!
> Key support: Holding around $1.40
> A potential breakout towards $3+ if bulls step in
> EMAs acting as resistance—needs reclaim for momentum
A bounce from here could lead to a massive rally!
DYOR, NFA
#Crypto #OP #altcoinseason2025

Analysis of OPUSDT Perpetual Swap (4H - OKX)Analysis of OPUSDT Perpetual Swap (4H - OKX)
1. Trend Analysis
Bearish Momentum Continues:
Price remains below EMA 50, EMA 100, and EMA 200, indicating a strong downtrend.
Multiple sell signals confirm continued selling pressure.
The price is hovering near the lower part of the structure, meaning it is still searching for strong support.
Potential Oversold Conditions:
The Stochastic RSI is at an extreme level, suggesting the market could be oversold and a short-term bounce may occur.
However, until a clear reversal pattern forms, the trend remains bearish.
2. Key Resistance Levels (Supply Zones)
🔴 Major Resistance Areas:
1.5030 USDT (EMA 50 Resistance & Fib 0.500 Zone):
If price bounces, this is the first major test for buyers.
1.6139 - 1.7025 USDT (EMA 100 & Fib 0.618 Zone):
A stronger resistance zone; if price reaches this level, expect potential selling pressure.
1.8999 - 1.9419 USDT (Fib 0.786 - 0.886 & EMA 200 Zone):
A critical area; breaking this would indicate a shift toward a bullish structure.
3. Key Support Levels (Demand Zones)
🟢 Crucial Support Areas:
1.4225 - 1.4335 USDT: Local support area; if this breaks, price could drop further.
1.3581 - 1.3150 USDT (Demand Zone & Entry Point):
This is a strong historical demand zone; if price reaches here, buyers might step in.
1.2850 USDT: A deeper support level, marking the last known major buying area before a potential larger breakdown.
4. Risks & Concerns
⚠️ Bearish Signals & Potential Risks:
Trend Still Bearish: Price is trading below all major EMAs, meaning any bounce could be a short-term retracement.
Weak Buying Volume: Without strong volume, even if price bounces, it may fail to sustain upward movement.
Possible Breakdown Below Support: If price breaks below 1.3150 USDT, further declines toward 1.2850 USDT are likely.
5. Trading Strategy
✅ Long Scenario (If Price Holds Support & Shows Strength):
Entry: If price bounces from 1.3150 - 1.3581 USDT (Demand Zone).
Target 1: 1.4335 - 1.5030 USDT (EMA 50 Resistance).
Target 2: 1.6139 - 1.7025 USDT (EMA 100 Resistance).
Stop-Loss: Below 1.2850 USDT to minimize downside risk.
✅ Short Scenario (If Price Rejected at Resistance):
Entry: If price reaches 1.5030 - 1.6139 USDT and shows weakness or rejection.
Target 1: 1.4225 USDT (Local Support).
Target 2: 1.3581 - 1.3150 USDT (Demand Zone Retest).
Stop-Loss: Above 1.7500 USDT to avoid getting trapped in a breakout.
6. Summary & Outlook
📌 OPUSDT remains in a strong downtrend, with support at 1.3150 - 1.3581 USDT.
📌 Key resistance levels are 1.5030 - 1.7025 USDT. If the price fails to break, expect continued downside.
📌 A bounce could lead to a short-term recovery, but bearish sentiment dominates.
📌 Trading Strategy: Wait for a confirmed bounce from support for long entries or short at key resistance levels.
🔎 Recommendation:
Monitor price action near 1.3150 USDT for a potential bounce.
If rejection happens at 1.5030 - 1.6139 USDT, consider shorting opportunities.
💬 Would you like a deeper breakdown of any specific area? 🚀📊

TRADE PLAN FOR OP FOR PROFITSHello, traders another opportunity to buy and hold OP for profits ,
we trade what we see , follow the chart and be guided.
tradehubng

The Long trade on the OPUSDTWe are in the flat channel and now we can move to the up level of this channel. Small trade with good risk\reward ratio.
$OP Long-Term Opportunity NASDAQ:OP Long-Term Opportunity 🚀
I believe this is a good spot buy zone for $OP. 📉 The price is hovering near a multi-year support level, and while it could still go lower, it’s a solid spot to start DCAing.
Patience pays, Chill Fam. Let's play the long game. 💎


OP USDTOP USDT
SPOT
This is a theory, I think you could be a buyer of a step at this price when the new top is seen during the ascent.


OP Long Idea- SFP
- trend line support
- FIB level
TP's in the purple, SL below the last wick
8.25RR

OPUSDT 1D#OP is moving within a falling wedge pattern on the daily chart and is on the verge of breaking out above the daily MA200, which is a bullish sign. In case of a breakout above the pattern, the targets are:
🎯 $1.926
🎯 $2.141
🎯 $2.315
🎯 $2.489
🎯 $2.737
🎯 $3.052
