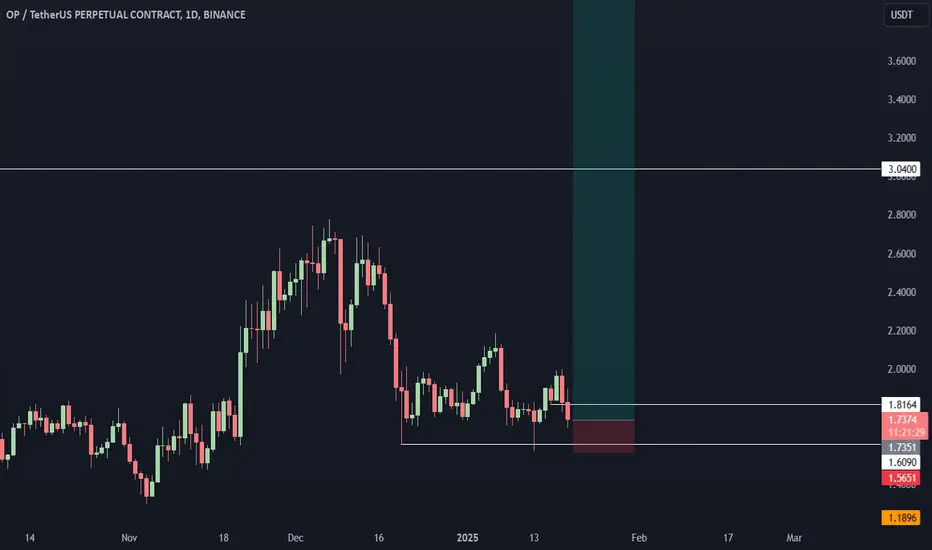
Ascending Channel , bullish uptrend , AccumulationNASDAQ:OP accumulated at the bottom in an ascending channel and now it is ready to pump.
Buy at level 1,70-1,75$
Tp1: 2.75
Tp2: 3.70
Tp3: 4.75
SL : 1.53
OPUSDT trade ideas

OP BULLISH BREAKOUT IS COMINGHI,
BUY OP AT MARKET PRICE $1.73
Stops below $1.50
and target 3$
$5
and $7
I have bought OP below 1$ and now I have bought more.
Let's wait and see!
OP BUY hello friends
I hope you are well.
As you can see in the chart, by correcting the price, we can buy step by step in the 2 specified support areas with capital management.
We have specified goals for you to be comfortable.
If you want an analysis, send us a message.
*Trade safely with us*

OP/USDTLayer 2 project has the best technology that many investment funds are interested in, target can be up to 7$ - 15$

OPUSDTANTICIPATING AN IMPULSIVE BULLISH MOVE.
After a transition from bearish to bullish trend { CHOCH }, anticipating a perfect retracement into the daily order block. An impulsive bull movement is bound to happen.
OPTIMISM - USDT
BULLISH SET-UP
SL: 1.475
ENTRY: 1.705
TP 1: 2.773
TP 2: 4.883

OPUSDT we will be suprise for coinlife :) Between 13.01.2025 and 20.01.2025, Op is seen as negative as long as it cannot exceed 1.88 level. If the support 1.64 is broken on the downside, if 1.55 rate is broken first, it can fall to 1.46.
When we look at the league map, according to those who hold short much more long, the range here is between 1.5337 and 2.022.
In the short section, 8.82M loss is expected in the long section, and if it reaches 2.022, 22.23M loss is expected.
Although the table looks negative, the map gives hope.

TradeCityPro | OPUSDT Starting the Week with a Drop?👋 Welcome to TradeCityPro Channel!
Let's prepare our charts during the last hours of the weekend. It’s possible we might see some movement in the coming week, which could likely be bearish.
Scroll Down to Check Out the Analytical Chart as Well!
🌐 Overview Bitcoin
As always, before starting our analysis, let’s check Bitcoin on the 1-hour timeframe. Even during this holiday, Bitcoin is still just ranging with no significant events, which makes sense as a new structure is needed.
I have a feeling that the upcoming week might be red. However, I suspect this short-term bearish wave will turn out to be a fakeout, leading to a reversal back upwards. This is just one scenario, though. Personally, I might open a long position after breaking the $95,323 level, depending on Bitcoin's dominance conditions.
🕵️♂️ Previous Analysis
In our previous OP analysis, we highlighted our spot trigger, which was after breaking $2.688. However, it was never activated. This, along with the engulfing candle, caused us to stay in the range box, fluctuating within the same zone.
📊 Weekly Timeframe
In the weekly timeframe, there isn’t much need for further analysis, as our previous one still holds.
However, the weekly candle closing tonight might indicate a continuation of the rejection trend and a move toward the $1.338 support. The decline in volume clearly shows that no one is trading in this market at the moment.
📈 Daily Timeframe
In the daily timeframe, we’re also in a daily range box. Currently, after being rejected at $2.681 and triggering the double top with the $2.161 support break, we moved a distance equivalent to a 1:1 risk-to-reward ratio for the double top pattern.
Right now, after a heavy rejection at $2.161—which was somewhat a pullback—we are at the $1.749 support. Previously, this level was the daily range box resistance, but it has now shifted and turned into support.
Regarding this shift in support and resistance, let me explain a chart detail. Look at the area labeled as "old support" on the chart. This was our previous resistance, but now it has shifted to $2.681, our new resistance. This is because the future (or the right side of the chart) shows two rejections from this area, making it more significant for us.
Meanwhile, the $1.749 support aligns with the 0.618 Fibonacci level when measured from the start of the wave, which holds significant importance in Fibonacci analysis. After breaking this level, we could see a move down to the $1.335 support.
If you’re holding this coin, it’s recommended to cash out temporarily below $1.335 and look for reentry points in the future. After breaking $1.749, a short position could also be opened.
📝 Final Thoughts
Stay calm, trade wisely, and let's capture the market's best opportunities!
This analysis reflects our opinions and is not financial advice.
Share your thoughts in the comments, and don’t forget to share this analysis with your friends! ❤️

Can #OP Bulls Defend this Key Levels or Not? Key Levels to WatchYello, Paradisers! Will #OPUSDT finally break free or are we about to see a deeper pullback? Let’s analyze the current #Optimism setup:
💎#OP is currently forming an ascending broadening wedge pattern, which often signals indecision but can result in a strong breakout or breakdown. The price is approaching a key resistance zone at $2.191, a level it must break decisively for bullish momentum to continue.
💎A confirmed daily close above this resistance would open the door for a rally toward the major resistance area between $2.800 and $3.000, where significant selling pressure could emerge. For this move to sustain, watch for strong volume and momentum to validate the breakout.
💎On the downside, #OPUSD is leaning heavily on the ascending support near $1.791, with a broader support zone sitting between $1.584 and $1.300. This area has proven to be a reliable base during recent declines, providing the liquidity needed for buyers to defend the trend.
💎However, if NASDAQ:OP closes a daily candle below $1.300, the bullish structure will break down, likely leading to a deeper retracement toward $1.000 or lower levels, signaling a shift in market sentiment.
Stay focused, patient, and disciplined, Paradisers🥂
MyCryptoParadise
iFeel the success🌴

OPtimism At Its Best!📌Fundamental:
- Optimism (OP) is a Layer 2 scaling solution for Ethereum that enhances transaction speed and reduces costs through several distinctive features:
- Optimistic Rollups: Processes transactions off-chain and submits them to Ethereum in batches, increasing throughput and lowering fees.
USE THE BITCOIN
- EVM Compatibility: Fully compatible with the Ethereum Virtual Machine, allowing developers to deploy existing Ethereum smart contracts with minimal modifications.
USE THE BITCOIN
📌Technical:
OP rejected the lower bound of the rising broadening wedge pattern.
I am expecting a movement towards the upper bound of the wedge, targeting the $6 round number.
📚 Always follow your trading plan regarding entry, risk management, and trade management.
Good luck!
All Strategies Are Good; If Managed Properly!
~Rich

My strong BUY plan for OPUSDT in SPOT assetOP is a good altcoin on the top.
My Plan for BUY BINANCE:OPUSDT
I saw Confirm Uptrend signal on H6 timeframe
I saw Break Up cloud - Buy signal (follow uptrend )
After a Correction in Uptrend, now I can make another plan for this Altcoin.
Entry Zone: 2.01 - 2.1
Stoploss: 1.73
Target : from 1R to 3R

OPUSD buy IdeaOP looks good moving in a megaphone pattern.
7 could be the target if the same trend continues.

op potential reversalKeeping things simple, 5 waves up and 3 waves down. Looking for a trend continuation to the supply area.


Op/usdt for altseason BINANCE:OPUSDT BINANCE:OPUSDT.P MEXC:OPUSDT COINBASE:OPUSDT
**Weekly Analysis of OPUSDT Chart**
Here’s the detailed analysis of the OP/USDT (Optimism/US Dollar Tether) trading pair based on the chart provided:
---
### **1. Key Levels**
- **0% (Low)**: **0.396** – Historical low.
- **0.618 Fibonacci Levels**: **3.157–3.300** – Key resistance zone, known as the "golden pocket."
- **0.5 Fibonacci Level**: **2.629** – Mid-level resistance and a potential target in the short term.
- **100% (High)**: **4.865** – Historical high or significant recent high.
---
### **2. Current Price**
- **Price**: **2.013** – The price is moving upward after a recent bounce from a support zone near **1.449**.
---
### **3. Support and Resistance Zones**
- **Support Zones**:
- **1.449**: A strong support area where the price previously consolidated and bounced.
- **Green Zone (1.449–1.00)**: Represents a broader support range if a bearish scenario occurs.
- **Resistance Zones**:
- **2.629**: A critical short-term resistance where the price might face selling pressure.
- **3.157–3.300**: The golden pocket (0.618 Fibonacci level), a strong resistance zone where pullbacks are likely.
---
### **4. Price Movement and Potential Scenarios**
- **Bullish Case**:
- If the price breaks above **2.629**, it may head toward the golden pocket at **3.157–3.300**.
- A breakout above **3.300** opens the path to the **4.865** high, representing a significant upward potential.
- **Bearish Case**:
- If the price fails to break above **2.629**, it may pull back to **1.449**, where strong support lies.
- A break below **1.449** would signal further downside toward the green support zone.
---
### **5. Fibonacci Retracement Insights**
- **Golden Pocket Zone**:
- The **3.157–3.300** zone represents the golden pocket, a high-probability reversal area.
- Many traders take profits or look for shorting opportunities in this region.
- **Current Range**:
- The price is between the **1.449 support** and the **2.629 resistance**, making it an important area to monitor.
---
### **6. Trading Strategy**
- **For Buyers**:
- Entry: Consider buying near the **1.449 support** or after confirmation of a breakout above **2.629**.
- Targets:
- Target 1: **2.629**.
- Target 2: **3.157–3.300**.
- Target 3: **4.865** (if strong bullish momentum persists).
- Stop-Loss: Below **1.449** to limit downside risk.
- **For Sellers**:
- Look for shorting opportunities near the **3.157–3.300** golden pocket zone if the price shows signs of rejection.
---
### **7. Indicators to Monitor**
- **RSI**: Check if the price is entering overbought territory near resistance levels.
- **MACD**: Look for bullish or bearish crossovers to confirm momentum.
- **Volume**: Ensure high buying volume supports a breakout above resistance.

OP Analysishello guys
We carefully analyzed this coin for you and determined the purchase areas and price targets.
If you are risk-taking, you can buy a step right here, otherwise, the two specified ranges in the case of a pullback are the ranges where we expect the price to move from there to the specified targets.
I am happy to support and follow us.
be successful and profitable

OPUSDT
Diamond Pattern and Price Movement:
This pattern, classified as a Diametric, signifies the completion of a corrective cycle and heralds the beginning of a new upward wave and bullish phase. The (g) wave has been identified as the final phase of this pattern.
Key Levels:
Optimal Entry Zone: Between $1.80 and $2.00.
Short-Term Price Targets:
Target 1: Around $3.30.
Target 2: Around $4.50.
Long-Term Price Target:
If the bullish structure is maintained, it is anticipated that the price may reach the $8.50 level within the next 250 days.

OPUSDT (chart:1h, position:long)We have a daily range where the price has been stuck since December 20. I expect the coin to rise from the middle level of the range when it picks up the liquidity of the previous day. The only resistance level for me is the price of $ 1.908. If we break it strongly with volume, I think we can usually go up to the price of $ 2.00. And if there is a false breakout at this level and trading starts below the level, I will wait for the price to drop to $ 1.70.

Chances for OP to UPAs per my Price Action trading analysis OP may go for the 2.77$ if there is no bearish sentiments in the market.
This is just my trade analysis as i'm still learning and may leads to loss so please invest wisely.

#OP/USDT
#OP
The price is moving in a descending channel on the 1-hour frame and is expected to continue upwards
We have a trend to stabilize above the moving average 100 again
We have a descending trend on the RSI indicator that supports the rise by breaking it upwards
We have a support area at the lower limit of the channel at 1.70
Entry price 1.77
First target 1.84
Second target 1.90
Third target 2.00

Opulous ($OPUSDT): Bullish Setup for a Strong Move
I spend time researching and finding the best entries and setups, so make sure to boost and follow for more.
Opulous ( BINANCE:OPUSDT BINANCE:OPUSDT ): Bullish Setup for a Strong Move
Trade Setup:
- Entry Price: $1.686 (Activated)
- Stop-Loss: $0.595
- Take-Profit Target:
- TP: $5.145
Fundamental Analysis:
Opulous ( BINANCE:OPUSDT BINANCE:OPUSDT ) is a revolutionary platform combining decentralized finance (DeFi) with the music industry. It enables artists to mint music as NFTs, allowing fans to invest directly in their favourite creators. This innovative approach to music rights and revenue sharing is gaining traction, with BINANCE:OPUSDT positioned as a key player in the growing MusicFi sector.
Recent partnerships and collaborations with global artists have further enhanced its visibility, making BINANCE:OPUSDT BINANCE:OPUSDT a token to watch in 2024.
Tokenomics Overview:
- Total Supply: 500 million BINANCE:OPUSDT tokens.
- Key Utility: Facilitates transactions for music NFTs and DeFi staking.
- Community Growth: Rapidly expanding user base with increasing NFT volume.
Technical Analysis (Daily Timeframe):
- Current Price: $1.898
- Moving Averages:
- 50-EMA: $1.700
- 200-EMA: $1.500
- Relative Strength Index (RSI): Currently at 65, reflecting bullish momentum nearing overbought levels.
- Support and Resistance Levels:
- Support: $1.600
- Resistance: $2.000
The price action indicates that BINANCE:OPUSDT BINANCE:OPUSDT is on a bullish trajectory, having already activated the entry level at $1.686. With strong support at $1.600, the token is poised for a breakout toward the take-profit target of $5.145.
Market Sentiment:
Community engagement around Opulous remains high, with significant interest in its MusicFi use cases. Social media chatter and increasing trading volume reflect growing confidence in its long-term potential.
Risk Management:
A stop-loss at $0.595 limits downside risk while allowing room for volatility. The take-profit target offers a massive **205% return** from the entry point, making this a high-reward setup for mid- to long-term traders.
Key Takeaways:
- BINANCE:OPUSDT ’s innovative approach to music rights through NFTs positions it as a leader in the emerging MusicFi sector.
- The trade setup offers an excellent risk-to-reward ratio, aligning with the token’s bullish momentum.
- Long-term holders could benefit significantly from this breakout opportunity.
When the Market’s Call, We Stand Tall. Bull or Bear, We’ll Brave It All!
*Disclaimer: This analysis is for informational purposes only and does not constitute financial advice. Traders should conduct their own due diligence before making investment decisions.*

OPUSDT 5DOP ~ 5D
#OP If you still have Conviction on the coin,. Buy gradually within this support block,. with a minimum target of 20++

#OP/USDT#OP
The price is moving in a descending channel on the 1-hour frame and is expected to continue upwards
We have a trend to stabilize above the moving average 100 again
We have a descending trend on the RSI indicator that supports the rise by breaking it upwards
We have a support area at the lower limit of the channel at a price of 1.75
Entry price 1.87
First target 1.95
Second target 2.03
Third target 2.11

OPUSDT Elliott Waves AnalysisHello friends.
Please support my work by clicking the LIKE button👍(If you liked).
Everything on the chart.
Entry zone: market and lower
Targets: 3 - 4.5 - 6
after first target reached move ur stop to breakeven
Stop: under 1.3 (depending of ur risk).
ALWAYS follow ur RM
risk is justified
It's not financial advice.
DYOR!
