Orbs to provide a 20x?Welcome back dearest reader!
Today we will analyse another project called Orbs. Looking at their website the fundamentals look great! But other than that, the chart also looks fantastic!
When looking at past performance its clear orbs has been in a massive flag formation since march 2021, it has broken out in october 2023 and has just now touched a very important support zone! Expecting upside momentum from here untill august.
Target: 0.40$
Stoploss: 0.0145$
ORBSUSDT trade ideas

ORBSUSDTI will buy this currency at this price and hold it until the target range. Good luck.
OKX:ORBSUSDT
BINANCEUS:ORBSUSDT

ORBS Network to the moonOn the above weekly chart price action has corrected over 90% since April 2021. A number of reasons now exist to be long, including:
1) Price action and RSI resistance breakouts.
2) Trend reversal. Higher highs higher lows replace lower highs lower lows.
3) Confirmation of support on past resistance. Horizontal blue channel.
4) The flag pattern flagpole measures a 2000% move to the 55 cent area.
5) Weekly GRM support confirmation. Some of you know what this means, some of your don’t.
Is it possible price action corrects further? Sure.
Is it probable? No.
Ww
Type: Trade
Risk: <=6%
Timeframe for long: Today
Return: 15-20x

ORBS clean pump and dumpThe Fbuy aggressive prints were bound to exhaust at some point and we had a very good sell point at the next 4 hour close.
Let's wait for the dropdown and see for further levels
To trade with indicator prints, you can contact me
DYOR

$ORBS breakoutHonestly, ORBS is one of the best-looking charts from a multi-timeframe perspective, it could pop up here.
We can see it's attempting for a breakout . Those poor high s are looking juicy!
$0.026 is proved to be a strong support. Hold this level, and we can see it going to $.032 - $.038 or even higher $.042

ORBS sell/short setupThe ORBS symbol has a bearish structure and is now approaching a supply range.
Liquidity pools are swept at the top of the chart.
At the bottom of the chart, we have a liquidity pool, the price is expected to collect this pool soon
It is expected to move down from the specified supply.
Closing a daily candle above the invalidation level will violate the analysis
Note that the financial market is risky, so:
Do not enter a position without setting a stop and capital management and confirmation and trigger.
When we reach the first TP, save some profit and try to move the stop continuously in the direction of your profit.
If you have any comments please post them, comments will help us improve our performance
Thanks

ORB. 0.02805. LONGThe token retests the key level. Large accumulation. There are no deep pullbacks. We may be ready to move up.

ORB. 0.02805. LONGThe token looks quite strong on the recovery. There are no rollbacks and goes to retest. There is a large accumulation under the key level, we can see a good long trade.

Is ORBS/USDT Poised for a Massive Breakout? Don't Miss Yello, Paradisers! Are you ready for some potential big moves with ORBSUSDT? Let's dive into the analysis to see what's brewing!
💎#ORBS is currently showing signs of a probable bullish continuation from a support zone at $0.02415. We've observed ORBS following a descending channel for quite some time. Recently, after breaking above the descending resistance, it's gaining momentum at this key support level.
💎If the price holds strong at this level, there's a high probability of a bullish rally, similar to previous trends. A breakout above the probable resistance at $0.03323 could lead to targeting the next resistance zones and beyond. However, if the momentum doesn't hold at the key support, we might see a bullish rebound from the lower support area around $0.01821.
💎It's crucial to stay vigilant and monitor #ORBS price movements closely. A daily closure below the support area could invalidate the bullish outlook and potentially lead to further declines.
💎Remember, Paradisers staying disciplined and patient is key in these volatile markets. Consistently profitable trading comes from waiting for the best opportunities. Stay focused and avoid emotional decisions!
MyCryptoParadise
iFeel the success🌴

ORB inteligentassetBullish scenario
Resistances 0.052, 0.0653 upper limit channel, 0.08
Bearish scenario
Supports 0.043 in 50 ema, 0.039 in 200 ema, 0.037 lower limit channel, 0.0299

ORBS Possible Bullish Scenario I expecting to break up symmetrical triangle.
We are above strong support zone.
And we are moving Uptrend.
Soon we will break up to the moon
ORB inteligentassetHigh volatility!
Bullish scenario
Resistances 0.052, 0.064 upper limit channel, 0.08
Bearish scenario
Supports 0.042 in 50 ema, 0.0377 horizontal & 200 ema, 0.0359 lower limit channel, 0.0299

ORBS is about to rise This token is about to climb to 0.045 and maybe could touch 0.05 as some sings and there is money flow in this coin which ignites after couple of days, like other coins that pumped
We will see that the pump

orb inteligentassetHigh volatility!
bullish scenario
resistances 0.037 in 200&800 ema, 0.0377, 0.0407 pivot high, 0.0433 upper limit channel
bearish scenario
supports 0.0347 in 50 ema, 0.03 lower limit channel & horizontal, 0.0266 pivot low

ORB inteligentassetHigh volatility!
Bullish scenario
Resistance 0.037
Next resistance 0.04 in 50 ema
Resistance 0.044 upper limit of the channel
Bearish scenario
support 0.035 EMA 200
Support 0.0299 lower limit of the channel

BREAKOUT COMING FOR ORBSHello traders, a look at the ORBS chart and we should expect a breakout coming for over 25% gains.
Tradehubng

OBRSUSDT I SWING LONG FROM 0.041$ WITH 3x-5x/BUY IN SPOT FOR 25%I will swing long OBRS from 0.041 to 0.5$ with 5x leverage don't take one entry go for partial entry and buying some in spot

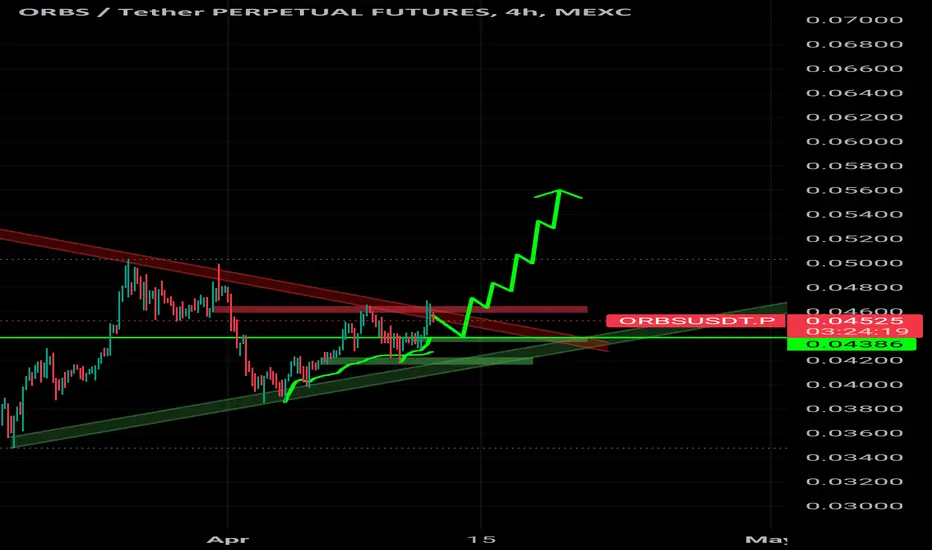
ORBS/USDT Poised for Resistance Breakout?👀🚀ORBS Today Analysis💎 Paradisers, focus on #ORBSUSDT as it presents an interesting trading scenario. The asset is currently making attempts to break its resistance, indicating a high likelihood of an upward movement.
💎#ORBS has consistently followed a descending channel pattern, breaking above it to initiate an upward trend. Presently, it's approaching a resistance break, hinting at a significant opportunity for a bullish movement. With its continued upward momentum, it is aiming to target resistance levels at $.05401.
💎 While newcomers may be quick to make hasty entries, seasoned Paradisers recognize the importance of timing in such scenarios. Identifying the most favorable entry points during this expected rise is crucial, along with being cautious about entering at the peak of the market.
💎 Additionally, be prepared for a potential bullish rebound from the demand level of $.04392 if #ORBS faces challenges in sustaining its upward momentum. However, a decline below this level might indicate potential obstacles in maintaining the bullish trend.
💎 In this fluid and changing market environment, strategic planning and effective decision-making are key. Crafting a comprehensive trading strategy that includes sound money management and a deep understanding of support and resistance levels is essential for achieving successful trading outcomes. 🌴💰

ORBS"Active has shown a significant decrease, reaching a strong support level at $0.4946, which has been unsuccessfully tested multiple times. Subsequently, a 'Triple Bottom' pattern has formed on the chart, indicating a reversal, as observed in the chart. After reaching the minimum price for the third time, there was a rebound followed by a steady price increase.

ORBUSDT"The asset was under strong pressure from short participants and reached a value of $0.49255, where buyers began to show their activity, and the price gradually started to rise. Subsequently, the coin began to form the 'Cup and Handle' chart pattern, indicating the presence of strong buyers. The final confirmation of this pattern occurs when the asset breaks through the resistance level from which its formation began, as we can observe on the chart.

ORBSUSDT.P LONGORBSUSDT.P Long Setup
Entry - 0.04547
TP1 - 0.04900
TP2 - 0.05478
TP3 - 0.06056
TP4 - 0.06634
TP5 - 0.07212
SL - 0.04450
Use low lev only!
Happy trading!
TYOR! DYOR!

ORBS/USDT TRADE SETUP!!Hello everyone, if you like the idea, do not forget to support it with a like and follow.
Welcome to this ORBS/USDT Trade setup.
ORBS looks good here. Breaks out from the symmetrical triangle and also the cup and handle-like structure. Currently, retesting the neckline. Long some here and add more in the dip.
Entry range:- $0.04370-$0.04470
Target1:- $0.049
Target2:- $0.058
Target3:- $0.064
Target4:- $0.070
SL:- $0.041
Buy on the spot or use low-leverage
If you like this idea then do support it with like and follow.
Thank You!

$ORBS Classic accumulationNow understand there is a lot of speculation taking place here. A lot of this can be invalidated by simple losing the current low, but the idea is fairly simple and relatively low risk considering we would be at the bottom of an upsloping channel.
We have also put in a fairly large double bottom here locally with a measured move of about 63% from here.
Step one would be confirming the double bottom. We would need to break above the local resistance, and we would target a 2.0 extension of the double bottoms height.
That would however bring us above the highs of the larger double bottom looking left.
I added some speculative wave counts and rough levels we could look as closer as we get some price action. But i do like how a lot of the levels and potential extensions have confluence with the idea of a rising channel.
If you were to use the supply line and call this a pennant or wedge of sorts, you would be looking at a measured move of 0.075 just shy of a 2.618 (0.083).
Just a thought for now, I expect nothing. This is more a mental exercise, and often times making charts like this and refering back to them when new data comes in, can offer some incite seeing how price action reacts to your levels of interest and expectations.
