ORDIUSDT Forming Falling WedgeORDIUSDT is currently displaying a classic falling wedge pattern on the charts, a formation typically associated with bullish reversals. This technical setup suggests that the recent downtrend may be nearing exhaustion, with potential for a strong upward breakout. The wedge has been forming with lower highs and lower lows converging toward a breakout point, and recent candles suggest bullish pressure is beginning to build. With good volume supporting the structure, the conditions look ripe for a breakout rally.
A breakout from this falling wedge could see ORDIUSDT gaining between 70% to 80% in the coming weeks, based on historical price action and wedge height projections. The increased investor interest and healthy trading volume add conviction to this scenario, making it an attractive setup for both short-term swing traders and long-term crypto investors. The asset appears to be forming a base, and if the breakout confirms above key resistance levels, it could rapidly advance toward new highs.
What further adds to the bullish thesis is the growing attention toward Ordinals and Bitcoin-native assets, of which ORDI is a prominent player. Market participants are gradually shifting focus back to unique infrastructure and innovation-driven tokens, and ORDIUSDT may benefit from this shift in sentiment. With bullish divergence on indicators and confirmation of a breakout, this could be a strong candidate for a high-risk, high-reward opportunity.
Traders should keep an eye on volume spikes and confirmation candles for a safer entry. As always, risk management is key in volatile conditions, but technically, ORDIUSDT shows a promising structure that deserves close monitoring.
✅ Show your support by hitting the like button and
✅ Leaving a comment below! (What is You opinion about this Coin)
Your feedback and engagement keep me inspired to share more insightful market analysis with you!
ORDIUSDT trade ideas

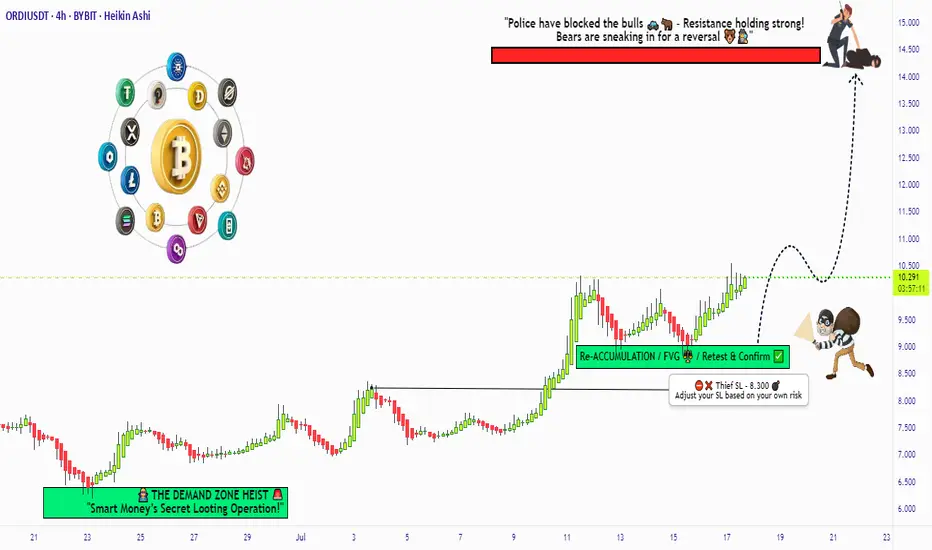
"ORDI/USDT: Pirate’s Treasure Trade! Bullish & Loaded"🚨 ORDI/USDT HEIST ALERT! 🚨 ORDI/USDT Bullish Raid Plan (Thief Trading Style) 💰🎯
🌟 Attention Market Pirates & Profit Raiders! 🌟
🔥 Thief Trading Strategy Activated! 🔥
📌 Mission Brief:
Based on our elite Thief Trading analysis (technical + fundamental heist intel), we’re plotting a bullish robbery on ORDI/USDT. Our goal? Loot profits near the high-risk resistance zone before the "Police Barricade" (bear traps & reversals) kicks in!
🚨 Trade Setup (Day/Swing Heist Plan):
Entry (📈): "The vault is open! Swipe bullish loot at any price!"
Pro Tip: Use buy limits near 15M/30M swing lows for safer pullback entries.
Advanced Thief Move: Layer multiple DCA limit orders for maximum stealth.
Stop Loss (🛑): 8.300 (Nearest 4H candle body swing low). Adjust based on your risk tolerance & lot size!
Target (🎯): 14.400 (or escape early if the market turns risky!).
⚡ Scalper’s Quick Loot Guide:
Only scalp LONG!
Rich thieves? Go all-in! Broke thieves? Join swing traders & execute the plan slowly.
Use trailing SL to lock profits & escape safely!
💎 Why ORDI/USDT? (Fundamental Heist Intel)
✅ Bullish momentum in play!
✅ Macro trends, & intermarket signals favor upside!
✅ News-driven volatility? Expect big moves!
⚠️ WARNING: Market Cops (News Events) Ahead!
Avoid new trades during high-impact news!
Trailing stops = Your best escape tool!
💥 BOOST THIS HEIST!
👉 Hit LIKE & FOLLOW to strengthen our robbery squad! More lucrative heists coming soon! 🚀💰
🎯 Final Note: This is NOT financial advice—just a thief’s masterplan! Adjust based on your risk & strategy!
🔥 Ready to Raid? Let’s STEAL Some Profits! 🏴☠️💸
👇 Drop a comment & boost the plan! 👇
(🔔 Stay tuned for the next heist!) 🚀🤫
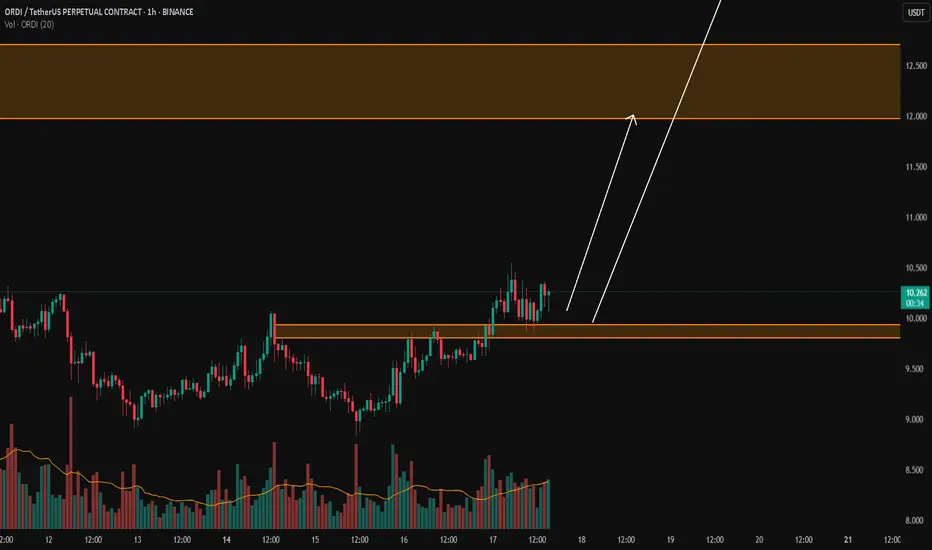
ORDI/USDTKey Level Zone: 9.800 - 9.930
LMT v2.0 detected.
The setup looks promising—price previously trended upward with rising volume and momentum, then retested this zone cleanly. This presents an excellent reward-to-risk opportunity if momentum continues to align.
Introducing LMT (Levels & Momentum Trading)
- Over the past 3 years, I’ve refined my approach to focus more sharply on the single most important element in any trade: the KEY LEVEL.
- While HMT (High Momentum Trading) served me well—combining trend, momentum, volume, and structure across multiple timeframes—I realized that consistently identifying and respecting these critical price zones is what truly separates good trades from great ones.
- That insight led to the evolution of HMT into LMT – Levels & Momentum Trading.
Why the Change? (From HMT to LMT)
Switching from High Momentum Trading (HMT) to Levels & Momentum Trading (LMT) improves precision, risk control, and confidence by:
- Clearer Entries & Stops: Defined key levels make it easier to plan entries, stop-losses, and position sizing—no more guesswork.
- Better Signal Quality: Momentum is now always checked against a support or resistance zone—if it aligns, it's a stronger setup.
- Improved Reward-to-Risk: All trades are anchored to key levels, making it easier to calculate and manage risk effectively.
- Stronger Confidence: With clear invalidation points beyond key levels, it's easier to trust the plan and stay disciplined—even in tough markets.
Whenever I share a signal, it’s because:
- A high‐probability key level has been identified on a higher timeframe.
- Lower‐timeframe momentum, market structure and volume suggest continuation or reversal is imminent.
- The reward‐to‐risk (based on that key level) meets my criteria for a disciplined entry.
***Please note that conducting a comprehensive analysis on a single timeframe chart can be quite challenging and sometimes confusing. I appreciate your understanding of the effort involved.
Important Note: The Role of Key Levels
- Holding a key level zone: If price respects the key level zone, momentum often carries the trend in the expected direction. That’s when we look to enter, with stop-loss placed just beyond the zone with some buffer.
- Breaking a key level zone: A definitive break signals a potential stop‐out for trend traders. For reversal traders, it’s a cue to consider switching direction—price often retests broken zones as new support or resistance.
My Trading Rules (Unchanged)
Risk Management
- Maximum risk per trade: 2.5%
- Leverage: 5x
Exit Strategy / Profit Taking
- Sell at least 70% on the 3rd wave up (LTF Wave 5).
- Typically sell 50% during a high‐volume spike.
- Move stop‐loss to breakeven once the trade achieves a 1.5:1 R:R.
- Exit at breakeven if momentum fades or divergence appears.
The market is highly dynamic and constantly changing. LMT signals and target profit (TP) levels are based on the current price and movement, but market conditions can shift instantly, so it is crucial to remain adaptable and follow the market's movement.
If you find this signal/analysis meaningful, kindly like and share it.
Thank you for your support~
Sharing this with love!
From HMT to LMT: A Brief Version History
HM Signal :
Date: 17/08/2023
- Early concept identifying high momentum pullbacks within strong uptrends
- Triggered after a prior wave up with rising volume and momentum
- Focused on healthy retracements into support for optimal reward-to-risk setups
HMT v1.0:
Date: 18/10/2024
- Initial release of the High Momentum Trading framework
- Combined multi-timeframe trend, volume, and momentum analysis.
- Focused on identifying strong trending moves high momentum
HMT v2.0:
Date: 17/12/2024
- Major update to the Momentum indicator
- Reduced false signals from inaccurate momentum detection
- New screener with improved accuracy and fewer signals
HMT v3.0:
Date: 23/12/2024
- Added liquidity factor to enhance trend continuation
- Improved potential for momentum-based plays
- Increased winning probability by reducing entries during peaks
HMT v3.1:
Date: 31/12/2024
- Enhanced entry confirmation for improved reward-to-risk ratios
HMT v4.0:
Date: 05/01/2025
- Incorporated buying and selling pressure in lower timeframes to enhance the probability of trending moves while optimizing entry timing and scaling
HMT v4.1:
Date: 06/01/2025
- Enhanced take-profit (TP) target by incorporating market structure analysis
HMT v5 :
Date: 23/01/2025
- Refined wave analysis for trending conditions
- Incorporated lower timeframe (LTF) momentum to strengthen trend reliability
- Re-aligned and re-balanced entry conditions for improved accuracy
HMT v6 :
Date : 15/02/2025
- Integrated strong accumulation activity into in-depth wave analysis
HMT v7 :
Date : 20/03/2025
- Refined wave analysis along with accumulation and market sentiment
HMT v8 :
Date : 16/04/2025
- Fully restructured strategy logic
HMT v8.1 :
Date : 18/04/2025
- Refined Take Profit (TP) logic to be more conservative for improved win consistency
LMT v1.0 :
Date : 06/06/2025
- Rebranded to emphasize key levels + momentum as the core framework
LMT v2.0
Date: 11/06/2025
- Fully restructured lower timeframe (LTF) momentum logic
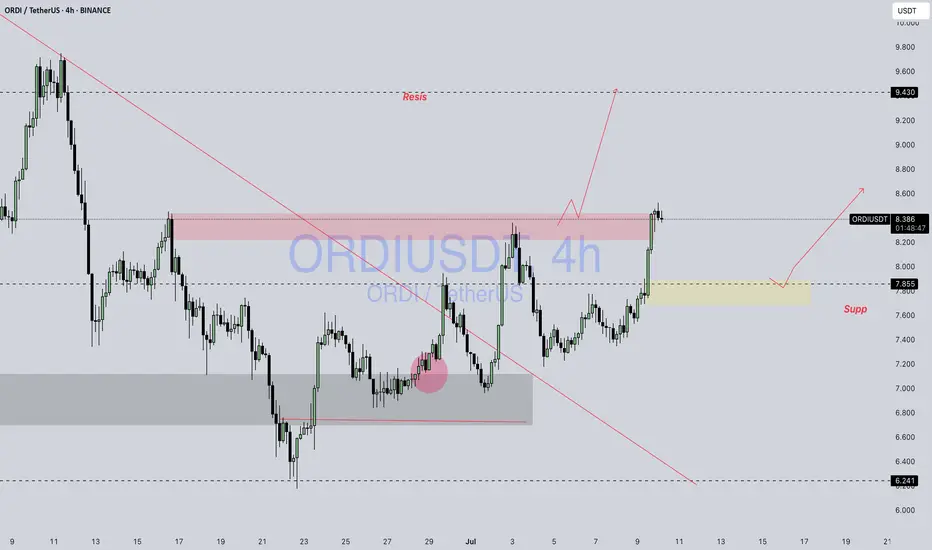
ORDI / USDTBINANCE:ORDIUSDT
### 📊 **Technical**###
* **Current Price:** \~8.377 USDT
* **Chart Type:** Candlestick (4H)
* **Trendline:** A long-term **downtrend line** has been broken, signaling a potential trend reversal or breakout.
---
### 📍 **Key Zones:**
1. **Resistance Zone (Red Box):**
* Located around **8.3 to 8.5** USDT.
* Price is currently testing this zone.
* A clean breakout with volume can send price toward the **next resistance at 9.43** USDT.
2. **Support Zone (Yellow Box):**
* Around **7.85** USDT.
* If price faces rejection from the resistance, it might pull back to this support and bounce from there.
3. **Next Major Resistance:**
* Marked at **9.430** USDT — likely the next target if the breakout sustains.
---
### 🧭 **Scenarios to Watch:**
* ✅ **Bullish Scenario:**
* Break and hold above the red resistance zone.
* Possible continuation toward 9.43 USDT.
* ⚠️ **Bearish Pullback Scenario:**
* Rejection from the red zone.
* Retest of the 7.85 support zone.
* A bounce here could still maintain a bullish structure.
Disclaimer : Not Financial Advice
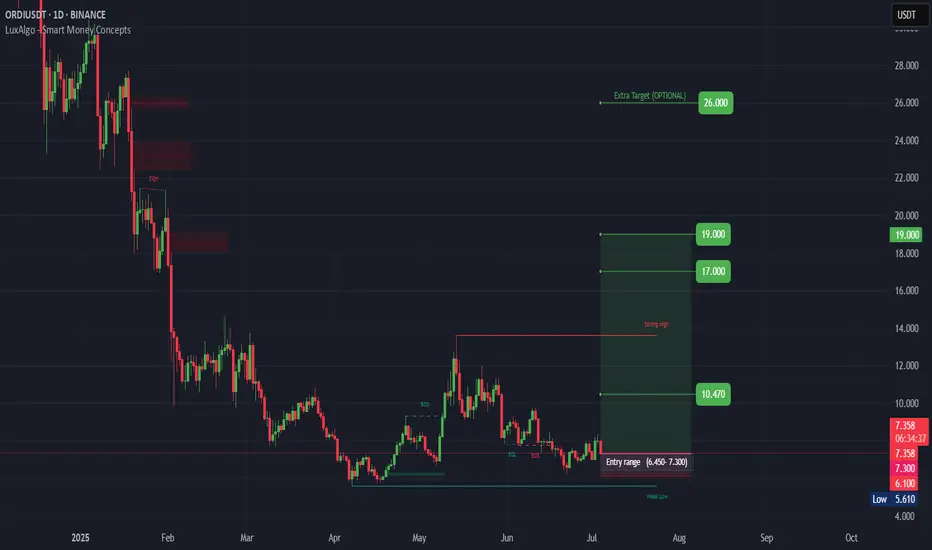
ORDI (SPOT)BINANCE:ORDIUSDT
#ORDI/ USDT
Entry(6.450- 7.300)
SL 1D close below 6.100
T1 10.470
T2 17.000
T3 19.000
1 Extra Targets(optional) in chart, if you like to continue in the trade with making stoploss very high.
______________________________________________________________
Golden Advices.
********************
* collect the coin slowly in the entry range.
* Please calculate your losses before the entry.
* Do not enter any trade you find it not suitable for you.
* No FOMO - No Rush , it is a long journey.
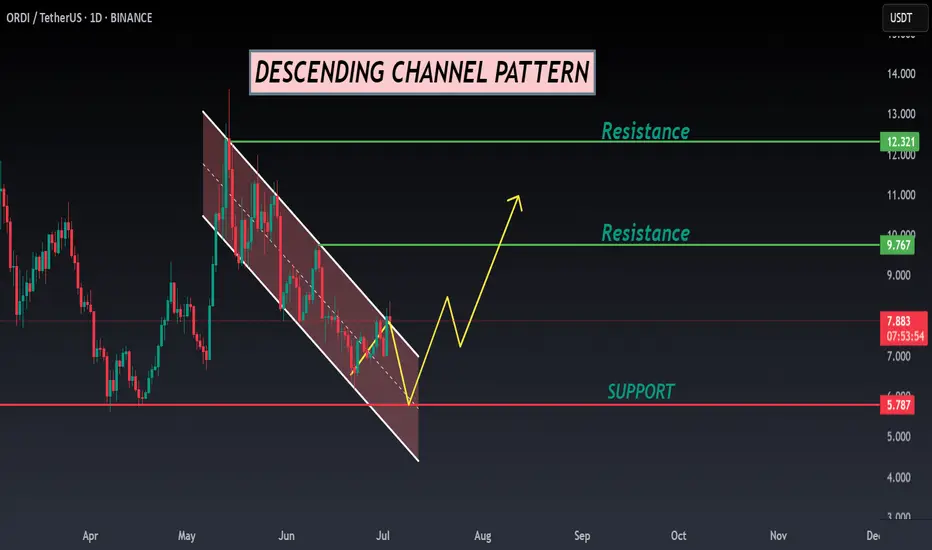
ORDI ANALYSIS📊 #ORDI Analysis
✅There is a formation of Descending Channel Pattern in daily time frame.
After a breakout of the pattern we would see a bullish momentum and can Target for $9.5 in few weeks🧐
👀Current Price: $7.890
🎯 Target Price : $9.500
⚡️What to do ?
👀Keep an eye on #ORDI price action and volume. We can trade according to the chart and make some profits⚡️⚡️
#ORDI #Cryptocurrency #Breakout #TechnicalAnalysis #DYOR
ORDIUSDT Forming Falling WedgeORDIUSDT is shaping up to be one of the more compelling opportunities on the crypto charts right now. The pair is forming a classic falling wedge pattern, which is widely regarded as a strong bullish reversal setup when spotted after a prolonged downtrend. This pattern often signals that selling pressure is fading and buyers are preparing to take control. With good volume building up, it’s clear that investors and traders are taking renewed interest in this project as it nears a potential breakout zone.
What makes ORDIUSDT even more interesting is the promising upside it could deliver if this falling wedge pattern confirms as expected. A projected gain of 70% to 80%+ makes this setup especially attractive for swing traders looking for medium-term positions with solid reward-to-risk ratios. The broader market sentiment is shifting, and coins with technically strong reversal setups like ORDIUSDT often outperform during such phases.
The community buzz and on-chain activity surrounding ORDI is also gaining traction, which adds further confidence to this bullish scenario. Many traders see the confluence of technical signals and increasing investor interest as a sign that this pair could soon break above its descending resistance line and rally aggressively. Keeping an eye on key resistance levels and volume spikes will be crucial to spot the right entry point.
✅ Show your support by hitting the like button and
✅ Leaving a comment below! (What is You opinion about this Coin)
Your feedback and engagement keep me inspired to share more insightful market analysis with you!

ORDIUSDT Hanging by a Thread Before the Next Leg Down?Yello Paradisers! Are you ready for the next big move on #ORDIUSDT? Because if you’re not already positioned or thinking three steps ahead, this structure could catch you off guard. We’re seeing signs of exhaustion, and the market is setting up for another potential drop. Here’s what you need to know before it's too late.
💎#ORDIUSDT remains in a clear downtrend, printing consistent lower highs and lower lows. Each rally is weaker than the last, and buyers have failed to break above key resistance zones. After the most recent failed bounce into the 7.28–7.51 area—where support has now flipped to resistance—sellers regained control and pushed price back below the 21 EMA. This confirms the
bearish momentum remains dominant and is high probability to go further down.
💎The structure continues to print classic breakdown signals. Multiple breaks of structure (BOS) further validate the downtrend. As long as price remains under the 8.47 invalidation level, there's no technical reason to consider a bullish scenario. Any short-term bounce into resistance is more likely to be a selling opportunity rather than a reversal signal.
💎If price continues lower from here, we’re watching the support levels at 6.46 and then the major support level between 5.79–5.53. A sweep of those levels could trap late shorts, but until we see a confirmed shift in market structure, our bias remains bearish. Patience will be rewarded here.
💎This is a classic scenario where retail traders often get chopped up. The real move comes after both sides get squeezed. Don't be part of the noise.
Strive for consistency, not quick profits. Treat the market as a businessman, not as a gambler. The downtrend is clear, but only disciplined traders will be able to extract profits here without emotional mistakes. Stay sharp, stay strategic, and above all—stay safe, Paradisers.
MyCryptoParadise
iFeel the success🌴

Ordi / Usdt BINANCE:ORDIUSDT
**Key Levels**
- **Resistance:** 7.855 (recent high) → 8.500 (next barrier)
- **Support:** 7.090 (today's low) → 6.241 (critical floor)
**Current Action**
- Trading at **7.118** (-1.96%) after testing **7.281** high
- Rejected from **7.281**, now near **7.090 support**
**What to Watch**
- **Bullish Case:** Hold above **7.090**, retest **7.855**
- **Bearish Risk:** Break below **7.090** → Drop to **6.241**
**Trade Setup**
- **Longs:** Only if holds 7.090 + volume (target 7.855)
- **Shorts:** If breaks 7.090 (target 6.500-6.241)
**Volume Alert**
- Weak bids → Risk of deeper correction
*(Not financial advice!)* 🔍

ORDIUSDT is BullishPrice is in a strong downtrend, however the bullish divergence with double bottom hints on a reversal, if previous lower high is broken then we can expect a bullish reversal as per Dow theory. Targets are mentioned on the chart.

ORDIUSDT 2D AnalysisORDI ~ 2D Analysis
#ORDI This is the lowest support block for now. Buy if you still have confidence in this coin with a short term target of at least 15%++.

ORDI/USDT – Bullish Falling Wedge Formation!!Hey Traders — if you're into high-conviction setups with real momentum, this one’s for you.
ORDI is forming a bullish falling wedge pattern and is currently consolidating near crucial support. The price is showing initial signs of breakout potential.
Here's the trade plan:
Entry: $7.20–$7.70
Targets: $9.20 / $10.50 / $11.90
Stop Loss: $6.50 (Strict)
Excellent risk-to-reward opportunity here. Keep your stops tight and manage your risk wisely.

ORDIUSDT 1D#ORDI — 2x Rally on the Horizon? 🚀
#ORDI is trading inside a Descending Broadening Wedge on the daily chart — a bullish reversal pattern.
A breakout above the wedge resistance and the daily MA50 could trigger a strong upward move.
If confirmed, the upside targets are:
🎯 $11.237
🎯 $12.975
🎯 $14.713
🎯 $17.188
⚠️ Always use a tight stop-loss to manage risk and protect your capital.

ordiSupport and press the rocket to cheer me up
Observe the ten percent loss limit
Stay away from Bitcoins
Feel free to buy and sell and post your comments

ORDI – Symmetrical Triangle Nearing Decision Point (4H)📐 SEED_DONKEYDAN_MARKET_CAP:ORDI is consolidating tightly within a symmetrical triangle on the 4H timeframe, and it's now pushing toward the upper trendline 📊
A breakout from this range could signal fresh momentum, but failure to break out cleanly might lead to more sideways chop ⚠️
Structure is compressing — volatility likely follows.
👁️ Worth keeping a close eye on this setup as the pressure builds.

ordiWe have a series of numbers that can be considered as medium-term targets. But in the short term, the red box is in the way as resistance.

Me thinks: ORDI USDT Short around 10.45ORDIUSDT short at 10.45. Sl @ 10.8 and Tp at around 9.3.
This is a winner. Don’t Fade. We dipping straight to hell..
~ W
ORDIUSDT heading to weekly supportORDIUSDT is currently trending down after hitting the weekly resistance WR1.
The price is likely to head to weekly support WS1. This support is going to hold the price and provide the bounce.
I believe, the price is very likely to bounce from WS1 and then move upward and on this attempt it may break weekly resistance WR1.
I will share the update once we have the price bounce from WS1 and trading around WR1.

$ORDI Enters Key Fib Support, Watching for Bounce!!SEED_DONKEYDAN_MARKET_CAP:ORDI
It’s not forming any clear pattern, but based on the Fib retracement, price is currently sitting in the golden entry zone around the 0.5–0.618 level.
Also, the 100 MA, which previously acted as strong resistance, is now working as support.
This setup looks interesting because of the tight stop-loss and high reward potential.
I’ve entered the trade with this logic.
Let’s see how it plays out 👀
#ORDI #CRYPTOMOJO_TA

$ORDI/USDT Breakout Alert!$ORDI/USDT Breakout Alert!
After months of a brutal downtrend, ORDI has finally broken the descending trendline with strong bullish momentum. 👀
Entry:- CMP
Targets:- $ 10, $16, $23, $32, $49
Stop loss:-5.67
Risk/Reward looks 🔥 if this move holds.
Eyes on continuation! 🚀

Ordinals Market Bottom, New 10X Bullish Wave In The MakingHere we have a true and perfect bottom. A rounded bottom.
The bottom is perfect because of the chart structure. First, there is a bullish wave, some bullish action. This is followed by a descent with a classic period of rest in-between the start and the end of the bearish move. After the down-wave is over, a perfect rounded bottom forms with a new All-Time Low. After the ATL, ORDIUSDT turns bullish. Classic sequence.
Here it is easy to appreciate how low Ordinals is trading compared to previous market phases, truly bottomed out. It is still trading below mid-November 2023. The only candle that is being matched right now is the first trading session in early November 2023 on the way up.
The same range was also active in February this year but this was part of the final descent.
The bottom leads to a recovery and the recovery will transform into a full blown bull market, growth long-term.
The targets on the chart are easy targets, it is likely that the new All-Time High in 2025 will end up being something higher than what is shown on this chart. Even if it doesn't go beyond, the second target amounts to more than 10X. Huge potential for growth.
Namaste.

ORDI USDT D1 CHARTWE ARE EXPECTING BULLING ON D1 CHART
THIS IS DAILY BASED ANYLIZED PLEASE ITS MAY TAKE LONG TIME HOLDING
Capital.com: the Middle East's best broker (TradingView, 2025). Trading carries risk. Quick, fee-free AED deposits – USD also available. Instant Price Alerts. Tight Spreads.

ORDIUSDT — channel, high risks, high rewards.ORDI is the first BRC-20 token based on the Ordinals protocol on Bitcoin. Since its launch in March 2023, the token quickly gained popularity and a significant market cap, being integrated into the Bitcoin blockchain. This integration is made possible through the Ordinals protocol developed by Casey Rodarmor. The protocol allows inscriptions - text, images, audio, or video - to be made directly on satoshis, the smallest unit of Bitcoin, giving Bitcoin new functionality that was not originally envisioned. You can now create NFTs and other digital assets and trade them directly on the blockchain.
____________
The token was listed at a fortunate time - late 2023 - amid overall market growth and positive sentiment. At the time, everything looked promising, but now the price has dropped by 94% from the zones where “hype was being sold.”
🔻 Structure:
The token is moving within a large descending channel. Recently, the price tested the outer support of this channel.
A local downtrend channel was also broken - its retest and a rise within the main trend are possible.
📊 Scenarios:
Retest and upward movement as part of a correction.
Consolidation in the current zone with a possible breakout to the upside.
Further decline amid overall negative market sentiment.
💥 Risks:
The token is traded on all major exchanges, including Binance. However, if it gets delisted (which has been happening more often recently), this is the main risk: loss of liquidity!
🎯 Approach:
With such tokens, it’s crucial to distribute volume wisely and accept risk in advance. I mark out interesting zones and place limit orders accordingly.
Considering the overall market and news backdrop, the token does have bounce potential, especially now that faith in the project is nearly lost.
💭 Opinion:
From my years of experience, I’ll say it again: the goal isn’t to guess where the price will go - it’s to be ready for it. Not everyone will understand that, but then again, not everyone consistently makes money in this market.
_________
📌 Not financial advice. This material reflects personal observations and a risk management approach.
