ES, NQ & YM Daily Trade Setups 23/04/25In this update we review the recent price action in the ES, NQ & YM and identify the next high-probability trade set ups and price targets. To review today's video analysis, click here!
DJIA1! trade ideas

US30 DIP BUYEASY DOUBLE BOTTOM RETRACEMENT. Having a retracement from the previous high and breaking volume direction.

Dow Jones (YMM) - Rough Around The EdgesDow Jones is great when studying the SMT divergences that occurs between YM. NQ and ES.
As a market i solely use to compare with NQ and ES, i would want to study how price delivers up to 41,147 and how NQ and ES follows suite.
If a NWOG forms, i will be interested to see what pair out of the three has a bigger gap and what PD array has been affected

Bearish Pressure Builds: YMM2025 Struggles Below Resistance
Downtrend Confirmed: The price has been in a strong downtrend since early March 2025.
Lower Highs & Lower Lows: Classic pattern of a downtrend is visible.
Wide Bandwidth: Bands widened significantly during the sell-off in early April, indicating high volatility.
Support Zone Near 38,000: Recent candles show buying interest around the 38,000 level with long wicks and bullish follow-through.
Bearish Gap Down Area: Large red candles and gapping indicate panic selling and potential resistance near the 41,000–42,000 zone.
Rejection at the moving average or mid-Bollinger band could lead to another sell-off toward 38,000 or even 36,500.
Failure to hold above recent lows may confirm continuation of the downtrend.

Dow Updated Market Analysis Range BoundApril 2nd, the market tagged the September FOMC by a hair and dumped off. Where did this 6000 tick dump end up stopping? To the 2023 yearly open by a hair. Price has found support at the 2023 yearly open 5 times before the monster rip.
Now we are in a range. I am waiting for price to run a high in order to take a sell.
So far, this week, price is oscillating around the Weekly Open.
I am expecting the 2023 yearly open level to fail and get dumped on and price to go to 30,000

Daily Price Action: Futures Dow Jones YM1! Tuesday 4/15/2025In this video, we are looking into the potential daily price action of YM1!.

Is it going to happen again? My view to the markets right now...CBOT_MINI:YM1!
Is the Dow Jones breaking the downtrend again?
I believe there's a strong chance the markets are setting up for another move higher. From a fundamental standpoint, the recent pause in tariffs is a big deal. It removes an immediate layer of uncertainty that’s been hanging over the global economy, especially for exporters and multinational companies. On top of that, the fact that key tech products have been left out of the latest tariff actions is boosting confidence in the sector that has been leading market strength for years.
Economically, we’re still seeing resilience in key indicators. Unemployment remains low, consumer spending is steady, and central banks are staying cautious with tightening. The environment still leans more towards slow growth than recession, which supports equities over the medium term.
More importantly, my own criteria for a favorable market setup are lining up. Whether it’s sentiment, intermarket signals, or trend conditions—this looks like a solid spot for a bullish stance.
You can see my chart to check out my current viewpoint on the Dow Jones and how I’m positioning based on all this.
Not Financial Advice
Tariffs ain’t it, just smoke and tricks . Learn the way, my sonsTariffs got you in a whirl?
Don’t be such a squirrel !
It’s an algo you nutjob, so play it like you understand the assignment , enjoy !

Dow Jones Weekly Trend Analysis Bullish Push - Bearish DowntrendThe weekly trend is bearish. Price is short term bullish to pullback into bearish resistance.
I have marked resistance as the red box. This is the bottom of the two bullish weekly candles that got eliminated.
This pullback will accomplish multiple things.
First, it will start to shake out people already short and get them to get out while they watch their profits evaporate.
Second, it will scare people from taking further short trades as they see extreme bullishness spike up
Third, it will induce people to go Long thinking this is a buyable dip, only to smash on them later, once the bearish trend continues.
Fourth, the people that bought in November and January are hoping and praying that price can get back up to a smaller loss so they can sell and get out. Right now, they are deep underwater.
Case in point?
You don't want to go Long right INTO a brick wall of resistance. You have a peak formation high in place, marked as the red triangle. You have the 2025 open overhead. You have November and January buyers turned resistance.
In a downtrend, you go short at resistance levels and ignore bullishness. You use bull bars to enter by shorting pop ups.

Dow Jones Quarterly Chart Market Analysis 2020 Opening SupportFollowing this 30% pullback into the 2020 opening price support, this will take out the 2022 lows, find support at the COVID highs and bounce.
60,000 is the measured move from 2020 open to 2024 highs. Expect some resistance there.
Price support of 31,000
After further thinking, I don't think price will return to 2018 open as I previously thought. Instead just down to 2020 open.
I have projected the 2025 Open because this will become support in the future after price starts retracing off of 60,000
Another key support area is the 50% range from 46,000-31,000 at 38,750

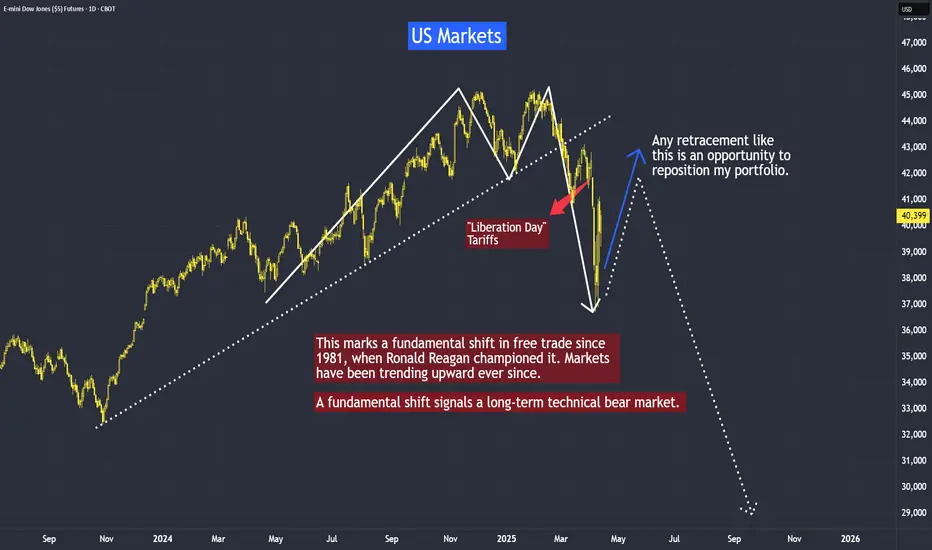
A Fundamental Shift Signals a Long-Term Technical Bear MarketE-mini Dow Jones Index Futures & Options
Ticker: YM
Minimum fluctuation:
1.00 index point = $5.00
Micro E-mini Dow Jones Index Futures
Ticker: MYM
Minimum fluctuation:
1.0 index points = $0.50
Disclaimer:
• What presented here is not a recommendation, please consult your licensed broker.
• Our mission is to create lateral thinking skills for every investor and trader, knowing when to take a calculated risk with market uncertainty and a bolder risk when opportunity arises.
CME Real-time Market Data help identify trading set-ups in real-time and express my market views. If you have futures in your trading portfolio, you can check out on CME Group data plans available that suit your trading needs tradingview.com/cme/
Trading the Micro: cmegroup.com/markets/microsuite.html
Don't get fooled by the counter trend rally, Bearish to 27,500Don't be suckered into this bear market rally. Price is still bearish and will continue to be so until the 2018 Open price has been hit of 27,500. A clue the market has shown is the bodies of the last three days are suspended above a key level. This is a sign that price will return. When prices find a low at a key level, the bodies are AT the level.
Case in point, bodies of the candles are AT the key level, not suspended above it. This is ALWAYS the case for a major low in the market.

European session - Futures, another day down?Each morning I connect at 9am italian time. I look at Asian indexes, then FTMIB, FDAX to see how Europe is responding to the tariffs story.
I start watching ES NQ YM GC CL in early US premarket. If volatility is good we can have some shots otherwise waiting for news (often 8:30 ET ) or 9:30 US open.
This morning is a waiting for me.
FTMIB is rejecting now the 33000 JLInes but too early to start trading it.

Markets Goal is 2018 Yearly Open and Covid Peak Formation Low The market's goal is to return to the Covid peak formation low, the 2018 yearly open and the middle of the 2018 range. Along the way, all the lows will be taken to achieve this goal.
Middle of Range:
COVID Peak Formation Low:
Returning to 2018 Open:
It is very clear to me now that this is the gameplan. I will remain a bear until the 2018 Yearly Open price of 27,500. This is a 40% retracement. My only concern is I don't know HOW price will arrive there and when. That is the challenging aspect of it. I AM 100% confident that 27,500 is the goal.
Looking at April 7th's lows, these are so very obvious that these will get dunked on and eliminated soon.

Party's OverDow Futures daily forming a downwards channel with price targets potentially down to 34k and 31k. These drops would be about 20-40% which is considered a true market crash. The falling wedge pattern plays out until potentially June of 2027, but wedges from the top of the range are dangerous as they can turn into bull traps.
- Economic fundamentals have been disconnected from the financial system for some time but as the underlying economy begins to falter (ex. unemployment wave) markets begin to price in data such as falling retail sales.
- President Trump is going through with mass layoffs in the Federal Government which creates unemployment as the private sector has been going through layoffs and has halted actual new hiring since 2023.
- As more traders have become accustomed to "bad news is good news," they will most likely be wiped out trying to buy dips or chase false breakouts doing what they have always done.
- Tariffs regionalize trade which make global economies and supply chains less interconnected. A global economy that is also very levered up on USD denominated debt needs dollar liquidity to continue to function. By regionalizing trade that liquidity is starved which can lead to financial problems on a global scale if not handled carefully.
- Markets are likely to price in these risks over the next 2-3 months leading asset prices and interest rates lower. Expect individual companies to do well at times but then rotate to others while the Dow index itself falls.
- Even if the Dow were to play out the wedge during 2026, without significant improvements to the global financial system expect that move to be a bull trap or a best lead to minimal gains without a new wave of monetary inflation.

Strategic Short Opportunity for Dow Jones Amid Volatility
- Key Insights: Given the recent market volatility, the Dow Jones appears poised
for short-term declines. The escalation of global economic uncertainties,
particularly surrounding tariffs and bond yields, suggests a challenging
environment for the index. With the Dow Jones down by 7.9%, it mirrors
broader market pressures, making a strategic short position potentially
advantageous for the coming week.
- Price Targets:
- Next week targets (T1, T2): 35,500, 34,800
- Stop levels (S1, S2): 39,000, 40,500
- Recent Performance: The Dow Jones experienced a significant downturn of
approximately 7.9% recently, reflecting widespread market pressures. This
decline aligns with similar movements in the NASDAQ and S&P 500, which fell
by 10% and 9.1%, respectively. The heightened volatility has been a notable
characteristic of the financial markets, with investor concern evident.
- Expert Analysis: Analysts are expressing caution regarding a prolonged bearish
trend for the Dow Jones. Despite some discussions about short-term bullish
setups, the overarching sentiment highlights prudence due to external
stressors. Factors such as tariff concerns and global economic uncertainties
are central to this cautious outlook, further exacerbated by the Volatility
Index (VIX) reaching levels not seen since April 2020, highlighting market
anxiety.
- News Impact: Recent market turbulence stems from various factors including
tariff announcements and global economic slowdowns. Particularly impactful
is the yield on the 10-year Treasury note dipping below 4%, signaling a move
towards safer assets amidst uncertainty. Additionally, the drop in crude oil
prices into the lower 60s aligns with broader economic concerns, projecting
potential impacts on global growth. These elements combined with elevated
volatility signify a cautious investor sentiment and a market under stress.

MYM Daily Swing TradeArrows show possbile pattern candle can make
Entry will be at the break and retest of trendline or wait to confirm
bounce of the trendline.

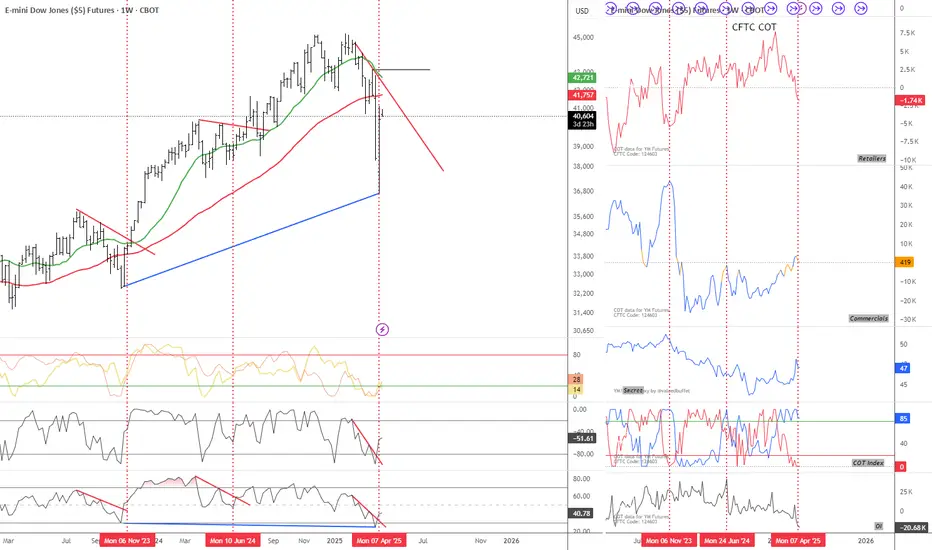
How to Identify Double Top Formation - A Long-Haul Bear?How to identify double top formation?
Is the US market still forming this double top formation, or has the pattern already completed, signaling a deeper correction to come?
In this discussion, we will focus on the latter question: whether this bear is going to be a long-haul bear.
3 parts of today tutorial:
1. How to Identify Double Top Formation is completed technically?
2. How to cross reference to its related markets?
3. How do the fundamental developments confirm these technical studies?
E-mini Dow Jones Index Futures & Options
Ticker: YM
Minimum fluctuation:
1.00 index point = $5.00
Micro E-mini Dow Jones Index Futures
Ticker: MYM
Minimum fluctuation:
1.0 index points = $0.50
Disclaimer:
• What presented here is not a recommendation, please consult your licensed broker.
• Our mission is to create lateral thinking skills for every investor and trader, knowing when to take a calculated risk with market uncertainty and a bolder risk when opportunity arises.
CME Real-time Market Data help identify trading set-ups in real-time and express my market views. If you have futures in your trading portfolio, you can check out on CME Group data plans available that suit your trading needs www.tradingview.com
Trading the Micro: www.cmegroup.com

April NFP Pump and DumpI am looking for a false break reversal after no follow through of a bullish bar. I will enter on the close of the bear candle that takes out the high bull. Trend is bearish until 30,000


YM / Dow Jones - long term perspectiveOn the CBOT_MINI:YM1! weekly/monthly/quarterly chart, nothing is looking out of the ordinary as of right now.
No matter what timeframe you're looking at, all timeframes have to go through cycles of rise and fall, and this current panic is just a normal red candle on the quarterly/monthly charts.
After this monthly/quarterly pullback, I'm still expecting a push higher to reach at least 48k before any longer term weakness should set in, if at all.
I see $34k-$38k as a mid-term discount zone, with 42-48k as a mid-term premium zone, with 48k as a magnet of sorts for price to draw toward.
I have 2 scenarios I'm currently watching for:
MID-TERM PULLBACK: Bull market stays intact, Trump ISN'T actually Hitler :-), price sweeps under $38k and sets up bounce back toward 48k from there.
LONG-TERM PULLBACK: World falls apart, Trump IS actually Hitler :-), bear market commences, multiple quarterly red candles, price does a deep pullback to $27.5k before rebounding from there.
SCENARIO 1 (seems most likely):
SCENARIO 2 (seems very unlikely):
Mostly, I would just counsel people to have a plan. "If bull market stays intact, do XYZ. If bear market develops, do ABC."

Dow Jones 32% Correction Bearish Bias UpdatedI have been proved wrong about being bullish lately. I took a couple L's and had to step back. Using the monthly chart, I have marked in blue lines every year's open. I can see a clear support area at the 2020 yearly open. This will take out the lows of both 2022 and 2023 low.
I will be ignoring any bullish bars in anticipation of them getting eliminated.
Yes, the long-term trend is indeed bullish, and this 32% correction will be a counter trend to the current bull trend.
The 2020 open is EXACTLY 50% of the high/low
Market declines in %:
Bearish Setups to employ:
Moral of the story? Don't pay attention to bullish bars as they will soon be wiped away.

Dow has a support around 40,800 but overall bearish sentimentBased on the chart, there is support at 40,800 on weekly chart. I think this might push the market up a little bit for the next couple weeks but I predict it will go down to test the yellow line which has a support only both weekly and monthly charts.
