Dow Jones Limit Buy Entry Trigger 42,027I am placing a limit order for a long position at 42,027 in the anticipation of a pullback to support. My stop is 150 ticks ( based on the 115 tick ATR ) and my target is 2.5 risk to reward or 375 ticks. Will I know if this support level will hold? No, and I don't need to. To me, this is a great location, and I am willing to put risk on to find out.
I am bullish the next three months and so, will mainly look for buy setups when they present. This trade, I am buying the level and not waiting for confirmation.
If you take the same trade, manage your risk as any trade can fail.
DJIA1! trade ideas

Bearish Outlook on Dow Jones Amid Corrective Phase- Key Insights: The Dow Jones is currently under bearish pressure with
institutional selling prevalent across major indices. The corrective phase
is expected to continue, potentially pushing the Dow towards support levels
between 39,800 and 39,700. Investors should prepare for market volatility
fueled by economic factors like upcoming tariffs, which may slow down
potential recovery actions.
- Price Targets: Short position advised next week.
- Targets: T1 = 39,700, T2 = 39,500
- Stops: S1 = 40,500, S2 = 41,000
- Recent Performance: The Dow Jones recently exhibited a downward trend, filling
a gap before moving further downwards similar to NASDAQ and S&P 500. This
decline suggests a consistent bearish sentiment is affecting the markets.
- Expert Analysis: Experts believe the Dow is in a corrective phase with an
eventual rally towards new highs expected post-correction. Current sentiment
remains bearish due to worries about tariffs and broader economic
challenges, but optimism exists for future recovery to levels above 47,000,
hitting as high as 51,000 in bull scenarios.
- News Impact: Market sentiments are marred by the anticipation of new tariffs
set to unveil on April 2nd. These tariffs could introduce significant
volatility impacting both equity and cryptocurrency markets, which will be
crucial for investors to closely monitor due to potential negative
influences on the Dow Jones trajectory in the near term.
MYM swing trade daily chartTrend lines are marked up on daily and the weekly trendline is the lowest trendline
the alerts are possible entries.
buy low, sell high unless it breaks support or breaks the trend wait for retest of that support
or trend line and buy or sell in that direction.

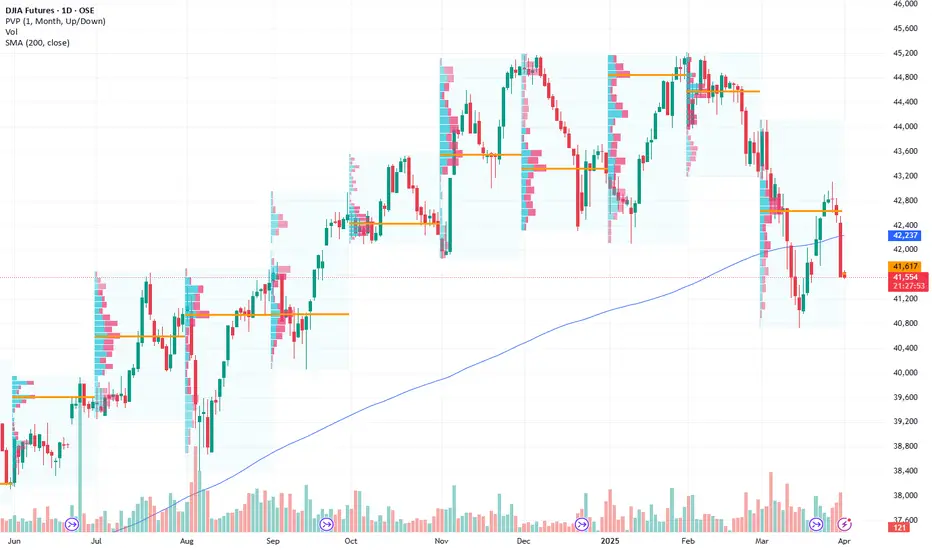
Dow Jones April Bullish Gameplan I am going into April Bullish. I believe this two-legged pullback is over on the Daily.
The ATR on the Daily has been a valuable tool to pick the lows. Every time ATR spikes and falls, that is the low.
I will be looking for price to slow down and layer into 41,580, form a higher low and start the bullish march back up.
The Monthly Chart
The Weekly Chart

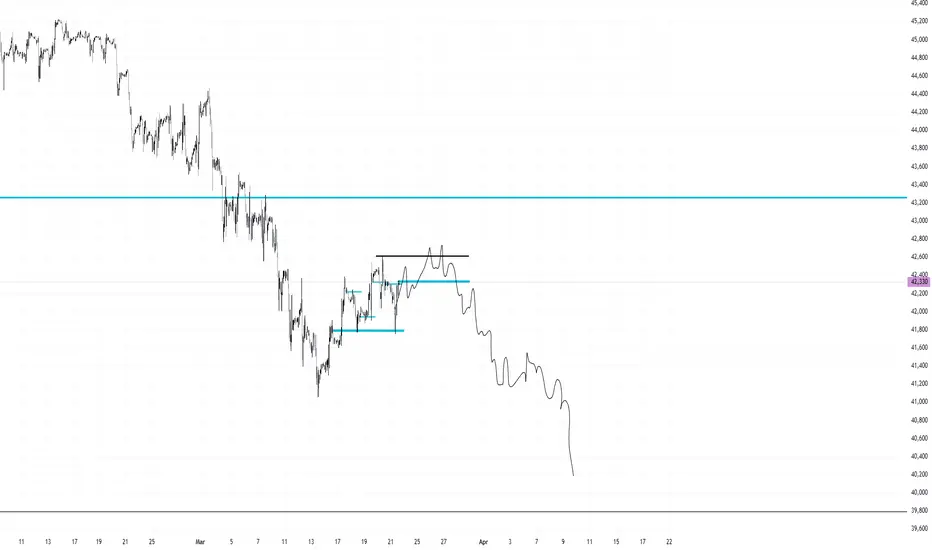
Dow Jones Futures Potential Short OpportunitiesDow futures reflect weak momentum, retreating after a 50% retracement of the prior 9% decline from 45075 to 40707, facing rejection at 43083.
Critical Supports: The immediate focus lies on 42416; failing this Support will accelerate losses to subsequent supports at 42214 and the critical 41882 level.
Resistance Levels: Strong overhead resistance at 42546, 42750, and notably at 42878.

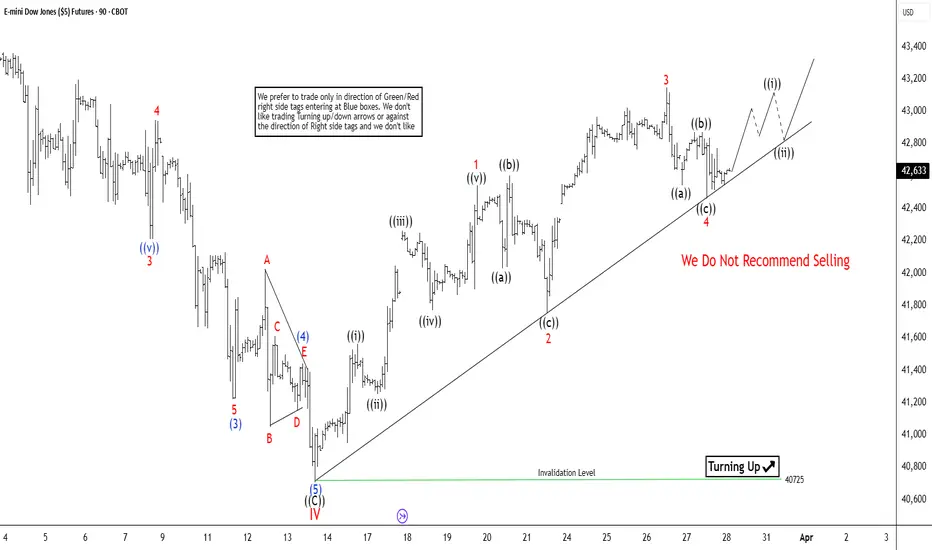
Elliott Wave: Dow Futures (YM) Poised to Continue Its RallyThe short-term Elliott Wave perspective for Dow Futures (YM) indicates that the wave IV pullback concluded at 40725, as illustrated in the 1-hour chart below. The Index has begun to climb in wave V. However, it must still surpass the prior peak of 45227, set on January 31, 2025, to eliminate the possibility of a double correction downward. The rally from the wave IV low has so far unfolded in three swings. For greater confidence in continued upward momentum, it’s advisable to wait until a five-swing pattern emerges.
The rally from wave IV is expected to develop as a five-swing diagonal Elliott Wave structure. From the wave IV low, wave ((i)) peaked at 41905, followed by a wave ((ii)) pullback that bottomed at 41587. Wave ((iii)) then advanced to 42388, with the subsequent wave ((iv)) pullback concluding at 41769. The final leg, wave ((v)), reached 42544, marking the completion of wave 1 on a larger degree. The ensuing wave 2 correction then found its low at 41751. From that point, the wave 3 rally reached its peak at 43148, followed by a wave 4 pullback that bottomed at 42459. In the near term, as long as the pivotal low at 40725 holds, anticipate that any pullback will attract buyers within a 3, 7, or 11-swing pattern, paving the way for further upside.
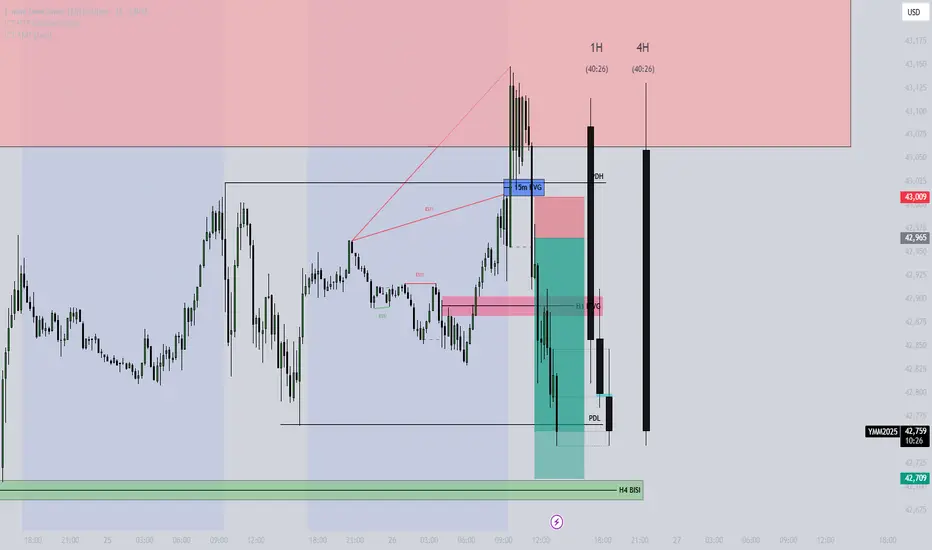
Dow Shorts - Cont'dI added another position on the retracement and took some off at the PDL now, the final target I am leaving for is the BISI and will close out the trade for today or if it hits my stop which is now halfway at the TP.
DOW Shorts: Better RRWhile NQ and ES was trending lower DOW was going higher. This was to take out stops, pair smart money orders and start the sell program. I waited for multiple confirmations before entering the trade. Buystops, rejection, CISD and IFVG. I could've entered earlier targeting even higher rr but the more confirmations there are showing bearishness, the higher the probability. This trade is risk free and partials have been taken. The stops will be adjusted accordingly and managed while letting the runner target the PDL. Let's see.

Dow Jones - Frontrunning Nasdaq & S&P 500When comparing Dow Jones to Nasdaq and S&P500, you will notice that this weeks price range is larger than the others, indicating that Dow Jones is the front running market.
Dow is the leading stock index pair to study. If I am expecting to see appreciation in NQ, ES, I want to see YM move first.

Last Week of March Possible Trending Cycle BearishThe last week of March is shaping up to be a bearish trending weekly cycle. I am looking for peak formation highs to be put in place and a bearish week to follow.
A sort of guide I am using is October 12th 2023
March 2025
The weekly chart shows a weak bullish resting bar that I believe will get erased.
My bias is still bearish for the remainder of the month
Promising Breakout Setup Ahead! Chart 1W CBOT_MINI:YM1! BLACKBULL:US30
Promising Breakout Setup Ahead!
The chart highlights RSI and Williams %R trendline breakout plays. My strategy? Identify trendlines on the chart, monitor RSI and Williams %R, and target breakouts on these momentum indicators.
Current Situation:
All key signals have already triggered.
Strong bullish seasonality
Favorable COT data (small specs bearish, commercials bullish)
Low open interest
This setup aligns with high-probability breakout criteria.
Chart Indicator
SMA 1W 52 (red)
SMA 1W 18 (green)
Bottom Indicators
WilVal
Williams R% 9 length
RSI 9 length
Not Financial Advice
for more questions ask in the comments or
check my X @valuebuffet

DOW JONES (FUTURES) SELL SET UPI have a 4hr down trend with a 1hr BOS and a 1hr RETEST for continuation down to previous low
HAPPY TRADING

ES, NQ & YM Daily Trade SetupsIn this update we review the recent price action in themini SP500, Nasdaq & DowJones futures contracts and identify the next high probability trading opportunities and price objectives to target. To review today's video analysis, click here!

US30 Bullish BiasFundamentals:
Valuation:
Undervalued on the 30d - 13d
Between the mean/Undervalued on 10d (projecting one more drop to undervalued on the 10 days)
Seasonality:
Following the price well. But I've explained that the price of Dow Jones reached a High 2-3 weeks before seasonality Tool predicted.
As per 5y 10y 15y seasonality, the bottom of US30 could be this week, or early next week. Whether we see another drop is something we can't tell. But Seasonality tool was late as per the example I've showed you on Trade Station, could be late this time around, and we could find a bottom within the next 5-6 trading days!
Technically: I've explained why I prefer the lower Daily Demand Zone.
The Demand Zone we are currently at - is where the Equilibrium lies as per Fib Tool - therefore not a good buy level!
Lastly, can we see one more heavy move down with A -3.5% on FOMC this Wednesday? We don't know, but it happened in December and it could happen this week!

Dow Jones - Tariff's Causing HUGE Disruption!Stocks rallied Friday, clawing back some of the steep losses seen over the week, as investors got a reprieve from tariff-related headlines.
But it does not mean that the bearish onslaught has ended. 41,790 - 40,347, 3-month fair value gap is still in play and although I am going into next week neutral, I would like to see a bullish draw up to 41790.

March FOMC Bullish Pullback Into Correction
Next week I am going in cautious because it will likely be a bullish counter trend week to pullback into the overall, bearish correction. Wednesday is FOMC.
We can also have another week down.
Ultimately, this is what I am looking for over the next couple of years.

I've Cracked the Bullish Code on Dow 30 Using COTNot financial advice.
YM is setup for longs based on COT Commercial Positioning Extreme, Valuation, Sentiment & Seasonals.

YM About To Move Up 350 Points!!!Based On My Trading Algorithms YM Is About To Move Up 350 Points!!!

YM (March 2025) - Pay Close Attention To Dow JonesWhen comparing the three pairs; YM, NQ and ES, it is evident that the weekly lows has still not been made, indicating the weakness bears have to push price lower.
The mean threshold of the 6th Jan 2025 has been respected, indicating the potential for a short term retracement on the lower time frames back up into 43409 - 43024 weekly previous bullish order block.
The most important days to study is Sunday to Wednesday.

US30 FUTURES SELL SETUPI have a Monthly overall uptrend with a Weekly leg making a new higher high. However, at the top of that new higher high, The Daily TF failed to make a new higher high which may cause the start of the Weekly retest. So for now I have a Daily downtrend with a 15min retest to continue down towards $40,000. If I'm wrong, price will break and close above $42,946 and continue upwards towards the last high which is $44,000.

Dow Jones Volatility Daytrading AnalysisI am writing this post to organize my thoughts on ATR and Volatility.
I have noticed that there are three different phases of Volatility.
Low
Medium
High
Using the 1 period ATR on the Daily chart, the high to low movement indicates what kind of Volatility one can expect.
Low Volatility is when, on average, the daily high to low is around 300 ticks +/-
300 ticks is just a number. What I am looking for is the percentage. Low Volatility seems to be when the high/low movement of the day is around 0.50%-0.70% of the price of Dow Jones.
Example:
If Dow Jones is at 85,000, then 0.60% would be 510. Therefore, a low volatility day within this price range would be 510 ticks on average.
Because Dow Jones is at on average 44,000 then a low volatility day using 0.60% would be 265 ticks. This is in line with 300 ticks on average.
On the 15-minute time frame, using the 14 period ATR, I try to line up the peaks of the ATR values. In this case, it lines up to around 50 ticks.
This information is vital in knowing how big stop losses and targets should be. If a low volatility day is around 300 ticks, then does it make sense to go for 300 tick moves? Depending on your risk to reward preferences, you can use ATR in a myriad of ways.
I personally use 1.25 times the 15-minute peak ATR as this is my entry time frame. The peaks are on average 50 ticks. This would give me an ATR stop loss of 62.50. I would round it up to 65 ticks.
If I was to take this hypothetical trade, I would use the 65 ticks stop and using 2.5 risk to reward, I would use 165 tick targets.
If one would like to go for a 1 to 1, then they can use twice the peak ATR of 50 ( 100 ticks ) and go for 100 tick targets.
Medium Volatility is around 580-600 ticks on the daily chart, or 1.25% from high to low.
On the 15-minute chart, this would be 90 ticks using the peaks of the 14 period ATR.
Using 1.25 times the ATR, I would arrive at 115 ticks for stop loss and using 2.5 risk to reward, I would target 290 ticks. This would give the trade room to play out.
High Volatility is around 850 ticks and above. On the 15-minute chart, High volatility is 135 ticks. Using my same 1.25 time ATR, the stop loss would be 170 ticks and the target 425 ticks, using 2.5 risk to reward.
If I were to take this hypothetical trade, and even having a not-so-great entry, using a 170 tick stop loss would allow me to take some heat on the trade but still stay in. Going for 2.5R, I would target 425 ticks.
Taking this other hypothetical trade, one could still be in the trade and achieve the profit goal without getting pinged out by wicks.
This allows a trader to not have the pressures of being so pinpoint accurate on their entries and to allow a trade to play out without getting pinged off the trade. We are not brain surgeons and therefore, do not need to be highly accurate and precise. You can be an average trader with good technical skills and still achieve success.
Using the ATR indicator is an art form and is not rigid in its application. You have to use judgement calls when reading the numbers. It is not a fool proof indicator and sometimes you will under or overcompensate what number to use.
I hope this post was helpful for anybody and feel free to leave comments down below on your thoughts. Thank you.

Will Dow Jones Extend Its Selloff?I believe Dow Jones still has more downside ahead. I anticipate a break below 42,200 tomorrow morning, potentially taking out more of January’s lows.
If price rises overnight, I’ll be looking for a Short position at the 8:30 CST open. If it doesn’t, I’ll likely go Long toward the dump initiation zone around 43,160 .
Alternatively, we could potentially begin the sell from 2025 Open Price.
Only time will tell—let’s lock in⚡

