NY1!, Sayonara means bye byei am waiting for new high :-)
But bearish divergence is giving serious warning on monthly chart
So time to bid farewell to Nikkei bulls and welcome Nikkei bears?
NK225M1! trade ideas

Breakdown of long-term consolidation down.Breakdown of long-term consolidation down can lead to the development of a long-term downtrend. The development of the downward trend on the index will stimulate the development of the downward trend of the yen.


Nikkei: long till 18604With weakening JPY we need to expect a stronger NIKKEI . Expecting a slow rise till 18600.


$NIKKEI - The Thin Red Line - to be, or not to be for Abenomics.Well ... we are one step over the precipice. The market is waiting for another #QE made in Japan. I hope that the strengthening of the yen is temporary and sell signals will be canceled.

Long Nikkei 225 Yen and Nikkie are USUALLY inversely correlated. Watch these two relationships carefully. I expect the Nikkei to decline by at least 4% before bouncing upward.

nikkei 225 weekly reversaldidnt reverse at a random spot either / 2 legs down and long term median line
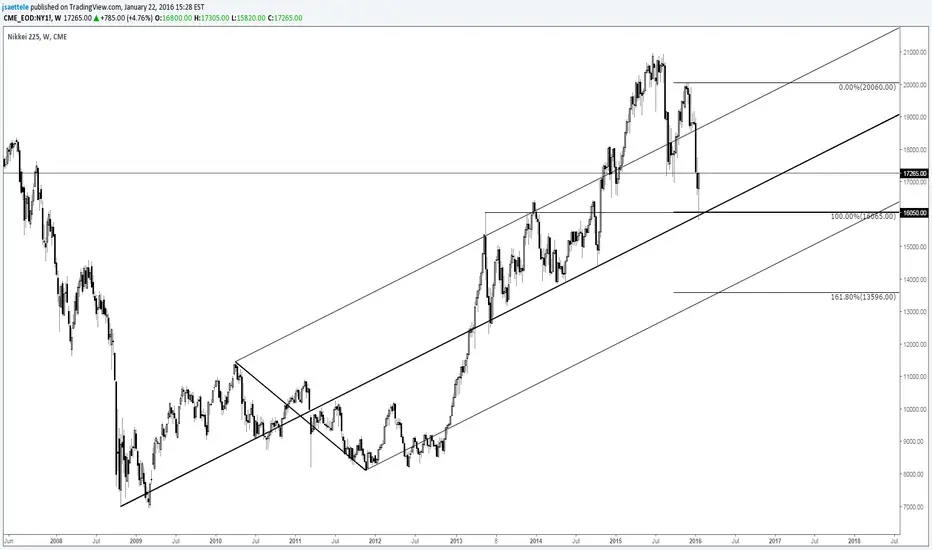
Short Term long till 18100 , but keeping Medium Term TargetKeeping Nikkei Target at 16000 but correction to 18100 this week certain

Short Nikkei 225Nikkei is leaving long term QQEx Channel with a SSHSS formation. Short- to Mediumterm Target is 16000

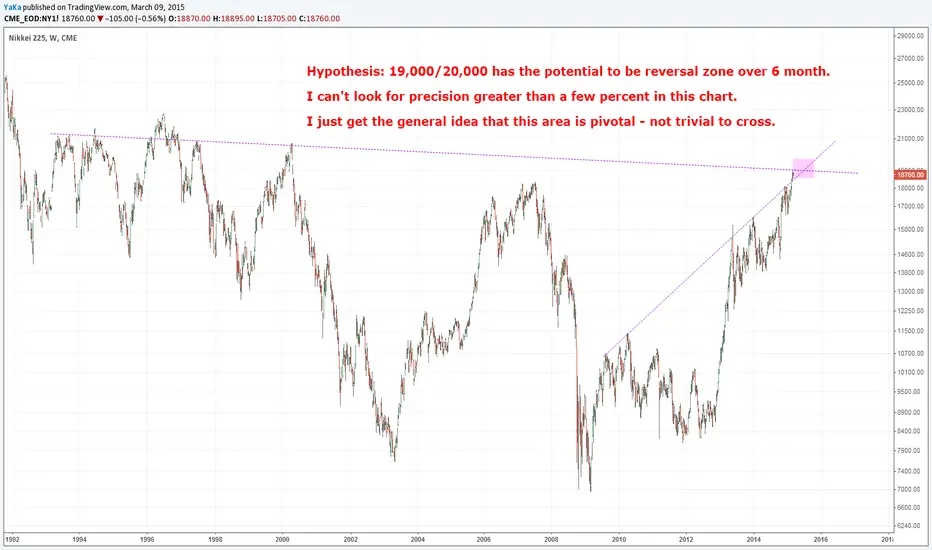
Nikkei CBOE DEC Futures-Watch Out for 19340 for further bullishnNikkei/USD Dec futures is consolidating between 19275 and 18675 level for the past four trading session.
The index is facing major resistance around 19340 (200 day MA) and any close above this level will confirm short term bullishness, a jump till 19800/20000 cannot be ruled out .
On the downside the index support is around 18900 and below this level it will reach till 18650. Further weakness only below 18650.
It is good to buy only above 19340 with SL around 19180 for the TP of 19780/20000

$NIKKEI - Extended Third WaveI'm still bullish on the Japan. QE /made in #Kuroda/ pushes indexes higher and higher. Rumor has it the new QE in October /after FED #ratehike??/.
thepatternsite.com

NIKKEI POSSIBLE TOP (1 HOUR CHART)Potential flag formation failure in the daily chart. The hourly chart shows the possible top. On the other hand above 20650 the bull trend will resume.

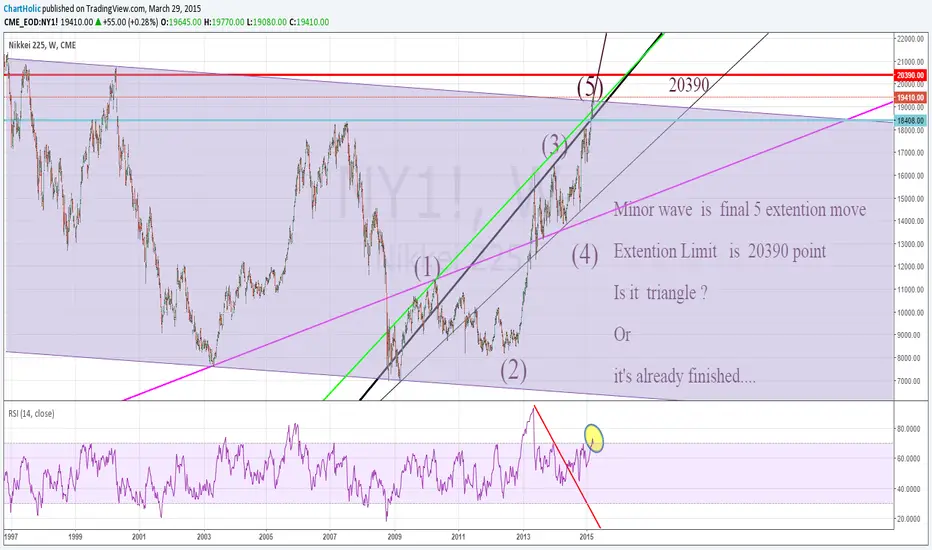
Minor wave is Final Extention Wave 5 extention 5 move
Strategy is Short start
but extention limit is 20390
Short Nikkei : Bearish Crab : Gap AheadShort Nikkei with bearish crab completing in between 19139 to 19756 (also a gap ) and a trendline resistance at 19139.
Short Nikkei and long XAUUSD

NIKKEI 225 (2000-2015)Monthly chart showing where we are. Just recovered the 2008 losses. 20000 on the horizon?

NIKKEI225-big HS patternAccording to my monthly analisis:
My bias is bearish on this index.
Here is a good chance to enter, at the beginning of the right shoulder of and HS pattern.
The 1.61 and 2.61 fib extensions coincide with the monthly chart.
Happy trading.
