going long on A2Mgood pull back into OB, going long from there. A2M is in a pretty good position in the asian markets, and milk is primarily not affected when it comes to formula which they also produce in very high quality.
ACOPF trade ideas

A2M.ASX_Bullish Range Breakout Trade_LongENTRY: 7.00
SL: 6.62
TP1: 7.37
TP2: 7.68
- ADX>25
- Daily RS +ve
- Daily FFI +ve
- Weekly RS +ve
- Weekly FFI +ve
- Moving averages are aligned.
- Entry today based on today breakout from range and >3% rebound off 10EMA with volume .

ASX - A2MFundamentals have deteriorated considerably with global cVD policies.
A2 wont go bankrupt with huge piles of cash,
but have they got a moat?
Purely of a technical perspective, no body is talking about A2.. its off the media, it's not on the headlines, these are the types of plays Peter Lynch likes, unloved, unwanted, but with solid balance sheets, average holding time for a turnaround like this is 5 years, so patience is the key, but wise to keep an eye on competition to see if they are taking market share in the meanwhile. It may be an asx market darling again at some point and it is all swings and roundabouts,
It really has held up bvery well IMO considering the somewhat orderly sell down in equities over the last several months.
We will see if this Bullish wedge can hold.

Long A2MPrice action is making HH and HL formation. Doji star candle pattern at HL. There is a strong resistance level at 5.50. if this level is broken we can see further price appreciation UpTo 6.00 and then 7.0. Good Luck. Al
Please do your own research before entering any position


A2M DirectionWaiting for a green monthly close and a weekly breakout. will be back to add in the bars in time. Will see how it goes.

A2M could be breaking downtrendOn watch for break of 200ma. Alot of volume recently and price action is looking healthy. Could be a good hold from here with a big target at $10.
Entry with a stop at 5.80 is to much risk for me. Wait for some confirmation on the chart.

Will A2M test $10 resistance ?If the $7.38 Climax Rally High is penetrated, next level to watch is $10 !
Anticipated short term movement to the upside is shown with a trend channel.
Awaiting further short stops to be hit soon !
This analysis is not a financial advise.

Here Comes the confirmed Bullish Pivot Point Reversal !This analysis complements all my prior posts of A2M.It shows what may be used as a trigger in real time (A Bullish Pivot Point confirmation) !
Watching the upper of the congestion now.
Link at Morningstar below also worth looking at.
app.elq.morningstar.com.au
This analysis is for educational purposes only showing the confirmed Bullish Pivot Point Reversal(short term bullish trend reversal) where it matters.
Enjoy !

Anatomy of a congestion in real time with A2MIt is important to know that the MAJOR TREND is still DOWN with obvious change in MEDIUM TERM TREND from DOWN to CONGESTION/TRADING RANGE where our analysis kicks off.
A real time study for those of us who may be interested in uncovering the motives of the smart money on display with A2M.
Boundaries as marked with the CLIMAX/EXHAUSTION LOW followed by CLMAX RALLY (counter trend). This counter trend move is highlights the change. This move fills the gap with vengeance making it an EXHAUSTION GAP. Inability of the seller, even with deep pockets(funds) with diminished selling power is now on display....
Now that the price is congested in the medium term, those with deep pockets, would try with their big buying and selling power to accumulate for the medium/long term....
Price tests and re-tests of important price levels, within the congestion, reveals their motives like the exhaustion gap being filled with a climax rally. Their medium/long term accumulation tactics are revealed by our charts.
Moving averages in use should also give us levels to watch which also gives us clues about the trend conditions...
Watch the boundaries of the GREEN BOX/RECTANGLE on the chart which is indicative of the current congestion(medium term trend).Once this congestion is resolved, next major move will be sharp and decisive....
This analysis is NOT A FINANCIAL ADVISE.

A2M needs to hold above 5.60 to avoid further decline.A2M needs to hold above 5.60 to avoid further decline.
Major support around 5.60, 4.50, and 2.60
Resistance at 7.40, 8.55
Low Pole formation and a valid BUT NOT ACTIVE vertical count.Due to the nature of the charting type (PnF 3 Box H/L with box size of 10 Cents) in use, we now have an established LOW POLE VERTICAL COUNT, yielding a bullish target of $11.30 which is valid but not active at this stage.
Target can also increase between know and activation trigger.
Potential V reversal and a new major bull run with A2M is still on the cards as SMART MONEY accumulation is now in full force....
This analysis is for educational purposes only showing the establishment of a PnF LOW POLE in real time.

A2 Milk ascending triangleATM has formed an ascending triangle. Also plotted some resistance/support lines from 2017

Is A2M Medium /Long Term accumulation in effect ?This analysis is for educational purposes only.
With the demolished down trendline/supply line, bringing the major downtrend to a halt/stop, potential long term accumulation is now considered to be in effect.
See chart for further simplified notes/analysis.

A2M - Has the Bearish trend changed finally?A2M had been falling in a strong downtrend until recently when it managed to break its downtrend line with very high volume. This price action suggests that the Bulls may have stepped in finally and want to take price higher. It could consolidate for a while before taking off. I am bullish A2M and targeting the recent Resistance level of $7.80 which could provide a potential 30% gain on the trade.
Please note these are my own notes, by no means trading advice. Please do your own research before entering into any trade.

C'mon MILK, eat the uptrend xDWe can see a double bottom with an uptrend to reach MA50-day, this may be a sign to buy.
For Australia international flaying closed border I don't have any hope, because after checking the vaccination rate of 2.7% is a low.
People are afraid of a possible 5th downgrade, I see only possibilities.
Let me know what you think about MILK A2 please ?

A2 buyer coming back Um it on support level and see tweeter candle. Buyer are coming in. Looking bullish .

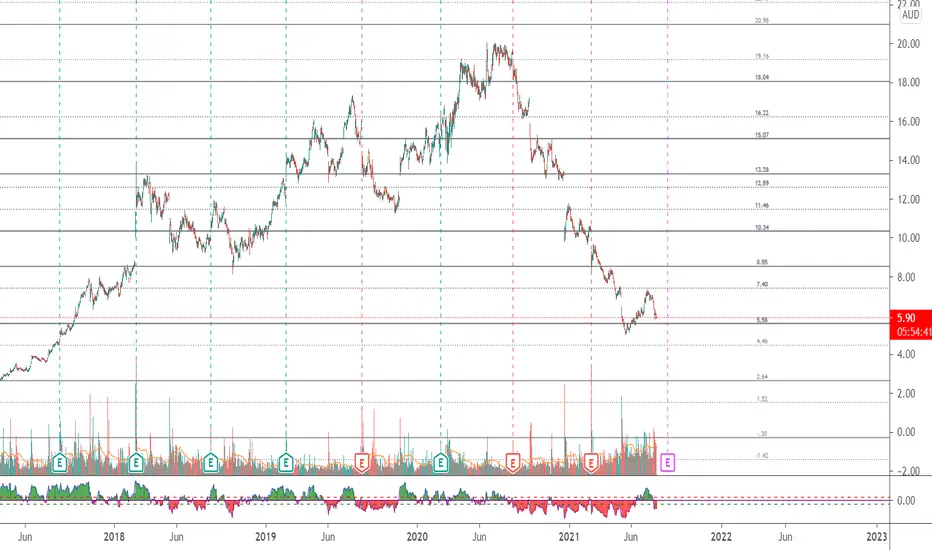
The a2 Milk Co Ltd 🧙The a2 Milk Company is a New Zealand licensor and marketer of fresh milk, infant formula, and other dairy products that lack the A1 beta-casein protein. The firm was founded in 2000 by Corran McLachlan, who developed a genetic test to determine which proteins a cow produces in its milk, and business partner Howard Patterson. The company has been through a tumultuous history of receivership, legal battles, and strategic shifts, but emerged in its current structure in 2006 and listed publicly in March 2013.
If you want not to miss ideas like this one,🎯 subscribe and press a thumb up! 👍 Have a question? Don't be shy to ask! 🤓 Interested to study how to analyze charts, follow me!

Weekly Chart #ASX #ASX200 #Stocks #investing #trading Hi all,
I like this pattern on the weekly chart.
Wait for consolidation and plan for a good entry.
Enjoy!

Can our charts uncover the motives of the SMART MONEY with A2M ?Notes for the analysis which is for educational purposes only.
What is the major trend ? Down & Strong.
What did the previously posted Point and Figure chart suggest with it's bearish target ? Possible end to the current major down trend at around $5.00 !
We will see the accuracy of the Point and Figure target over the weeks ahead. It is an estimate and a forecast.
Have we seen the MAJOR SELLING CLIMAX or is it just a PRELIMINARY SELLING CLIMAX ?
No, one knows this and I will not guess it. Time will tell (supportive of the MAJOR SELLING CLIMAX or otherwise).
Focus (compare price & volume behaviour) on Box of Tricks # 1 & 2 as they offer clues.
Compare volume at each down thrust after the gap down.
Check the volume at current congestion marked with Box of Tricks # 2 and compare it with the volume of Box of Tricks # 1.
Is the volume behaviour indicative of an accumulation or re-distribution by the SMART MONEY ?
Watch the resistance line of the larger down trending channel in order to recognize when the major down trend is at HALT/STOP. Violation of the resistance line will signal this.
Have fun !
