ACOPF trade ideas

A2 Milk shorting opportunityExpecting the price to encounter a lot of selling preassure. If we break the resistance we can wait for a pull back before we but. Until this happens we should short at the top of the resistance level.

A2M - A2 Milk Company [Bulish Flag Setup]A2M looks set for a continuation off its bullish flag pattern, finding support at the 200 MA.
Blue sky above if it breaks through the top of the range / Will look for near-term support if it breaks through the bottom of the range
Note as the company is trading at a high PE, failing to meet forecasts/targets can have a significant impact on share price.

Bull Flag on A2M.ASXThere is a decent Bull Flag setting up on A2M, an ASX stock.
Any bullish trend line breakout would support a thesis for continuation.
Technical theory suggest that the extent of any bullish breakout move might approximate the previous bullish push higher, that is, what they refer to as 'The Flagpole'.
The 'Flagpole' in this instance is worth about $10. Thus any bullish breakout would trigger near the $10 mark making the target for any bullish breakout move as $20.
I will be watching for any weekly close outside of the trend lines.

A2M.ASX - TAA2M - A great run in today's session up by about 7% and looks like its going to pullback at 10.11 resistance. Major resistance at 10.41 - 10.61

Sour milkLooks like a bubble just burst.... or the milk just curdled? Interactions at each fib level marked so we could see some bounces on the way down. Looks like every other cryptocurrency I watched over the last 6 months; personally anticipating a head and shoulders to emerge. New to stocks though so let's see.

A2M gapped downFundamental looks good although what caused this sell-off today is unknown to me. anyone knows anything?

A2 Milk past indicatorsGreetings,
I few weeks I posted an annotated chart of A2M stock and was predicting the future price trend:
imgur.com
Now that time has passed I have observed that in fact the head & shoulders/neckline indicator resulted in a slightly negative trend, however, later on we saw a trend reversal, as predicted by the falling wedge, as the 50 day moving average broke the upper resistance line:
imgur.com
Just a penny for your thoughts :)

Head & shoulders top + falling wedgeNot very experienced with technical analysis so would like to know peoples thoughts on A2 Milk's future stock prices based on these 2 indicators.
Falling wedge = potential bullish breakout
Head & shoulders top = potential bearish breakout

A2M - Short to medium term price forecastShare prices are currently approaching 11.85 a critical resistance price point after bouncing off at 11.74 support in recent trading activities. If successful then we could be looking at 12.00 for the next resistance price point. A break above 12.00 could see prices continue towards 12.37-12.68

A2M.ASXCalled out this morning when the share prices were up by 1.49% at 12.93 indicating that it could reach 13.02. Well, share prices managed to close at 13.06 up by 2.67%. The next resistance is at around 13.24,13.54 and support around 12.68 and 12.37

A2M.ASX Short term TAShare prices closed today's session around 12.20 resistance price point up by 3.65%. Share prices need to hold above the current resistance before we could see further moves to the upside. Failure could see prices fall to around 11.45. The next resistance is at around 12.76-13.14

Agriculture stocks to grow your wealthHello penny stocks followers,
I am sorry about that I might a bit side-tracked to the cryptocurrencies trading recently.
Here are two penny stocks to buy & hold for longer term.
Do you know both SM1 & A2M was struggling in last 84 days?
A2M just slightly continues to soar after the resistance zone breakout.
In the other hand, SM1 is struggling at the descending triangle pattern. It is at the point 4'.
The 20 & 50 EMA crossover may give you some hints. I may say the safer entry point to be above the previous high (point 3') or above the top of red ichimoku cloud.
I may analyse a bit more penny stocks before Australia Day !!!

A2M Great run so far and getting ready to go againThis is a classic high growth stock. Making huge amounts of cash and growing quickly. Opening new market in New York after already dominating in Australia.
Trend up with a consolidation pattern going on. I would wait till a high move breaking into fresh air before adding to my already large position.
A2 Milk for those unsure is based on some cows producing A1 milk which has a differing protein that is not as healthy. The shelves in the Australian Supermarkets are dominated by the product.
Company Now in the Top 100 In Australia.

Long Mr MilkIdea: Support holding and more long.
DISCLAIMER:
This is where I practice ideas and work on my trading techniques. Please note I am only providing my own trading information for insight to my trading techniques, you should do your own due diligence and not take this information as a trade signal. Trade at your own risk.

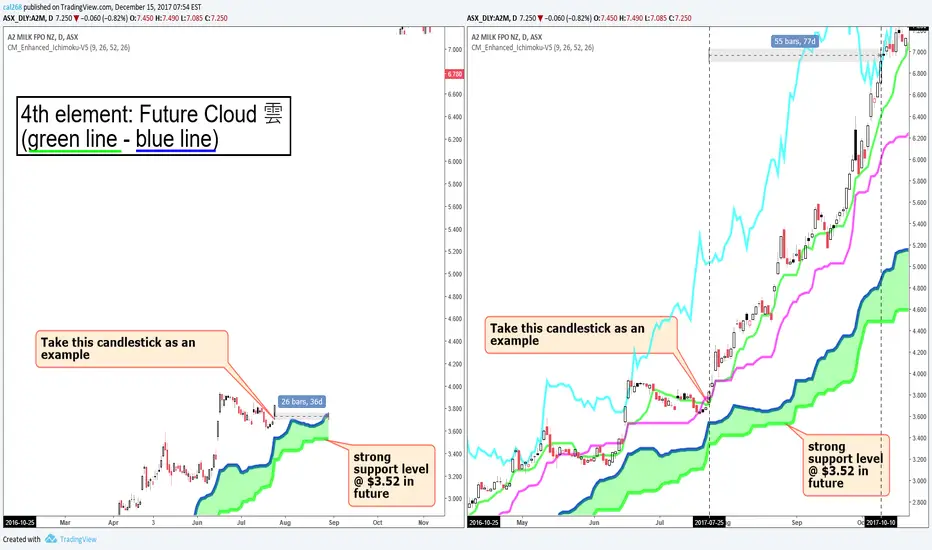
Ichimoku Analysis Lesson 3 of 5Future cloud is shifted forward 26 periods
I hide the right part of the price actions on the left chart to show you the future cloud ends 26 days periods forward. Please note that some brokers' Ichimoku indicator doesn't include this function.
By adding the 1st, 2nd & 3rd elements into the right chart, we have a complete Ichimoku chart.
As you see the Tenkan-sen & Kijun-sen overlap nearly 5 days after 2017-07-25. Tenkan-sen finally takes off. Also, the chinkou span is above price.
These are the evidences to show A2M is trending upward BULLISH.
Until 2017-10-10, chinkou span stuck in the price.
By using this strategy, A2M rose from $3.8 to $6.9 in 55 bars
Ichimoku Analysis Lesson 2 of 5Tenkan-sen and kijun-sen measure the short term TREND and the short term SUPPORT.
Tenkan-sen following price indicates the trend is strong
Tenkan-sen is FLAT the price is consolidating or not Trending
First observation of the Tenkan-sen is if the line is above or below the Kijun-sen
Tenkan-sen is the highest and lowest price over the past 9 periods divided by 2
It is the first level of support and resistance
Kijun-sen is the highest and lowest price over the past 26 periods divided by 2
It is the second level of support and resistance
Remember: Tenkan-sen and Kijun-sen are not moving averages.
It is arguly to declare:
When Tenkan-sen is above Kijun-sen, it is trending upward (BULLISH)
When Tenkan-sen is below Kijun-sen, it is trending downward (BEARISH)

Ichimoku Analysis Lesson 1 of 5Ichimoku system is composed of FIVE elements and was developed to show only support and resistance.
Chinkou span represents the closing price it also represents past support and resistance levels.
BULLISH Chinkou span is above price
BEARISH Chinkou span is below price
NEUTRAL Chinkou span is in the price

A2MStarting to feel more bearish sentiment regarding China... and this Superstar performer starting to look wobbly.
Trend eroded, punched in a new high without any follow through... and there are gaps to fill below...

ASX:A2M Break outsThe a2 Milk Company is displaying very nice technicals and isn't showing any short term signs of weakness.
Long term uptrend forecasted to continue into the distant future.


A2M awaits solid volume for SHORTA2M is currently struggling at $3.90.
On the 4h chart, can you see a long wick high test bar?
On the D chart, can you see a hanging man?
High test bar and hanging man are bearish candlestick pattern. I do not recommend buy this stock.

A2M Soars before EOFYIn this graph, I tested a programmer’s indicator called “ADX and DI with SMA on this stock.
The crossover worked well by its default SMA value (10). Price actions showed it performed as a trend. Therefore, we apply Fibonacci Extension to see where we are looking to take profit.
When to buy ?
It really depends what investor you are: Aggressive or Prudent ?
You saw a simple triangle breakout in this graph that you may see many times in Forex. Dark cloud pattern on point 2 (blue), but surprisingly, the stock price didn’t fell under 40 EMA. It performed a reversal at point 4 (black) instead. You will also notify that point 4 was also lying on the top of the Fibonacci channel which gives some sort of support.
If you were a prudent trader, you would trade triangle breakout near point 3 (blue).
If you were an aggressive trader, you would trade the swing low near point 4 (black).
When to sell ?
Any Fibonacci Extensions levels. For this case, I expect $4.20.
If I sell it now, I have 17% in 4 days
I’d expect to sell it near $4.20, which gives me 27%
Risk:
Watch the DI- value carefully in this indicator. DI- is near 10, it implicit the current stock price may reach an overbought level. Is this always true? Again, there are no indicators tell you stock price up or down 100% correct. We have to do a lot of mind read in order to understand the whole picture.
