CBAUF trade ideas

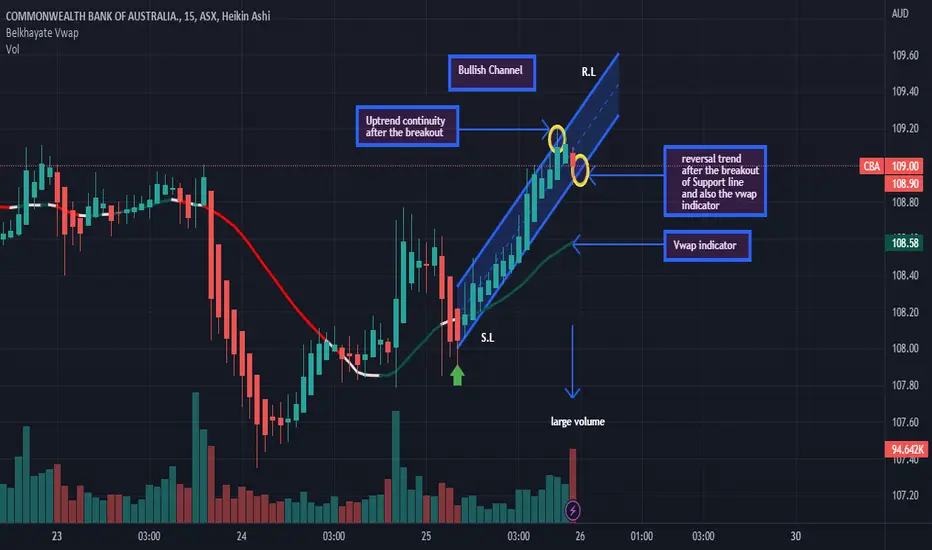
Analysis: Bullish Channel: two situationsFirst of all we are in an uptrend and we will not go against this trend because we are above the vwap indicator. However, we could have a continuation of this uptrend if and only if we break the resistance line with strength by a large green candle and followed by large green volume. On the other hand, we could also have a reversal of the trend, ie a downtrend. But this can only come true when the support line and the vwap indicator have been forcefully broken by a big red candle and accompanied by a big red volume. Thanks.!

CBA *breaking point soon* --> SHORTCBA has formed a large rising wedge with declining volume, RSI has now hit oversold. Go figure which way this will go. They're going to have to take on COL's catchphrase DOWN DOWN, PRICES ARE DOWN.

bank contagonCS will trigger a chain reaction
CBA will feel it too.
its all in the fibonacci levels.
loans to home buyers have hit saturation levels.
no one left to to feed the ponzi....
debt brings consumption forward... and tomorrow is now today.
time to pay the piper.
in OO programming., we call the destructor to clean up
~cleanup();

Buy @ $80~ And Don't Look Back.Correction should end around $75-81~ - we're in a macro wave 3 price will continue to trend up higher for a long time.

A potential dead cat bounce A potential dead cat bounce
I am expecting a test of the top of the channel if prices break 94.30, areas of interest at 95,97, and 100

CBA short, then comes back in 2025based on the current situation with bonds and interest rates, cba will correct. reflecting a correction in house prices. I think the correction will be mild to medium (15-25% from here) putting CBA down to about $62 a share or lower reflecting increase in bad debt, lower consumer sentiment.
it will be held low throughout 2023 as the market finds its feet (XJO would have tanked to 5400 by then) and there would still be uncertainty regarding inflation and the recession. mid 2023 should see inflation invert to deflation reflecting a year on year reduction from this years prices to 2023 prices ( i think we are temporarily over elevated) i still think we are in a net inflationary period however there could be residual overshoot in 2022 which will correct in 2023 sending CPI into deflationary territory.

COMMON WHEALTH BANK OF AUSTRALIALoss of acceleration on the RSI and possible breakout of a stagnation pattern.
.

CBA - Bullish 6-week SetupCommonwealth Bank of Australia has just posted 4 consecutive losing weeks but remarkably remains above its 200-day moving average. Since 2000, a weekly losing streak of this length while still respecting the 200-day moving average is rare. Data paucity caveats aside, similar events have been unusually kind to CBA, with a 6-week average gain of 4.9% & win rate of 6 from 6.
Disclaimer: This data is not financial advice. Past performance is not a guide to future performance and may not be repeated. Past performance does not diminish the risk expectancy of any strategy. By its very nature ‘risk’ means you could and most likely will experience losses. No representation or warranty is given as to the accuracy or completeness of any information provided. Data is for educational and informational purposes only.


CBA - Following MACD Daily Histogram below 0 for 25 days Since 2000, Commonwealth Bank (CBA) has displayed a consistent 15-day return following a 12, 26, 9 MACD Daily Histogram below 0 for 25 consecutive days & volatility was trending lower (50-day Average of Absolute Daily Deviation is lower than the 200-day Average of Absolute Daily Deviation). Average return of 2.80% with an unblemished win rate of 20 from 20.
Interestingly, despite the recent market gyrations, CBA remains above its 200-day moving average. If we include the additional context of this MACD event being triggered while CBA was above its 200-day moving average the sample size drops to 10 events, but the average return increases to 2.89% over 16-days with a 10 from 10 win rate.
Disclaimer: This data is not financial advice. Past performance is not a guide to future performance and may not be repeated. Past performance does not diminish the risk expectancy of any strategy. By its very nature ‘risk’ means you could and most likely will experience losses. No representation or warranty is given as to the accuracy or completeness of any information provided. Data is for educational and informational purposes only.

CBA - Following 3 Down Weeks & Price above 200-day maCommonwealth Bank CBA has just recorded 3 consecutive down weeks but remains above its 200-day moving average. Since 2000, this type of weakness has occurred 23 times. Following this, the 6-week forward interval provided an average return of 5% with a win rate of 21 from 23 events.
Disclaimer: This data is not financial advice. Past performance is not a guide to future performance and may not be repeated. Past performance does not diminish the risk expectancy of any strategy. By its very nature ‘risk’ means you could and most likely will experience losses. No representation or warranty is given as to the accuracy or completeness of any information provided. Data is for educational and informational purposes only.

CBA longshould have nice bounce back to $103 if hold above that resistance line should hit $106, 4 week time frame with 15% swing

CBA (ASX) - Elliot wave and Potential zones of interest
Elliot wave complete since COVID March 2020 low
Projecting FIB targets for a zone of interest to potentially start accumulating or pyramiding long.
A confluence of FIBS with Key horizontal Support, moving averages (200EMA), and Ichimoku.
Wait for base to form and confirmation before entry and market sentiment to support the bais.

Easy Trade - Mean ReversionHit by fears of inflation and now fears of Omicron (the transformer). Looking like an easy long for a bounce towards $100.
MACD showing a move towards zero line.
Tight stop at current low of $92.70
Large market cap straying too far from it's True Range.
Already green on this trade but would be nice to get at least another $3.

Wyckoff distributionMajor sign of weakness shown with the recent big drop, signalling trend change. Anticipate final leg up to around $100-105 before mark down to $88 and test there.

CBA Wyckoff DistributionThis is my first publishing and purely for educational purpose. DYOR
It seems that CBA is forming Wyckoff Distribution - Phase D UTAD, coming in range with high volume and wide price range. It might take support from ICE (Green dashed line) and could continue to fall till next support zone around $90.
Lets see how it goes. Fingers crossed
Thanks.

CBA @ 17 NOV 2021Text me if you have any questions/comments for me.
-----
CBA
- Previous video analysis was done on 13 Oct (red arrow) – suggested waiting for a successful rebound above $109 before plotting entry
- Today, the stock gapped down below the short- and mid-term supports
- It closed below the strong psychological support of $100
- Coincidentally, today is the 4th time the stock has gapped down back towards the $100 level -> I personally don’t think this is significant. Just that it’s curious coincidence
- A successful rebound look to be around $104 levels
- Strategy-to-buy (DYOR) – Suggest waiting for a series of HHs and HLs


CBA @ 28 OCT 2021Text me if you have any questions/comments for me.
-----
CBA
- First time doing a written analysis on CBA
- During the FB livestream on 24 Oct, I suggested the stock is worth a look if there is a successful breakout of the strong resistance (orange line)
- Stock has some history of uptrends but also suffers from sudden strong pullbacks
- Today’s close is above the strong resistance but was no accompanied with above average volume
- A successful breakout is above 107.50 levels
- R is less than 10%
- Strategy-to-buy (DYOR) – Suggest waiting for a successful breakout before plotting entry if believe the stock is capable of forming new all-time highs

Distribution top - expecting a correctionDivergence has appeared on the short term and long term Stochastics. It warns of a possible correction.
Supporting this possibility is the large step up in volume at $99 without a corresponding increase in price. So we know some distribution is occurring but where is support? There's no supporting volume until the $83 to$81 mark, so this may be the short term target if prices were to breakdown.
Divergence can fail. A weekly close under $96 would give further weight that a correction is under way.
All of CBA's price action since the beginning of 2019 puts the control price at $81.93 (on weekly chart). This is currently marked at $80.26 on the chart idea above

