CBAUF trade ideas

CBA Down trend buy optionsBuying opportunities.
58-62 (0.5 fib little support)
52-53 (0.38 fib with strong support).

[COMMONWEALTH BANK OF AUSTRALIA] SIMPLE SETUPSpeculative bearish setup...
If you think this analysis can be useful, leave a your comment or your LIKE!
Thank you for support and trade with care!

Can we go Lower?If we continue to trade in the channel we may continue to go lower and find a bounce in the area suggested(possible end of ABC correction) and that will be the sign of a trend reversal, however a breakout to the upside out of the channel could also dictate the same, would like to hear thoughts.

$CBA in DT channel and range zoneprice has broken to the upside 4 times in the past of this range zone in yellow.
It looks to test the range's support again within the red channel.

$CBA $70.28 doin a death roll PER requestChart has notes
Bet it doesnt stop next time it pauses on support
Too slow for me but entertaining all the same
See tls.ax for a similar slow death, now in recovery

CBA - Long - 6% by End of Year- Just a simple observation, price is bouncing around the level.
- Looking at it , it has gone up for a 2 month period then down for a 2 month period.
- Looking to go LONG , on the DAILY . So possible 6% growth by 2019 .
What do you guys think? Just by looking at the chart on the daily ?

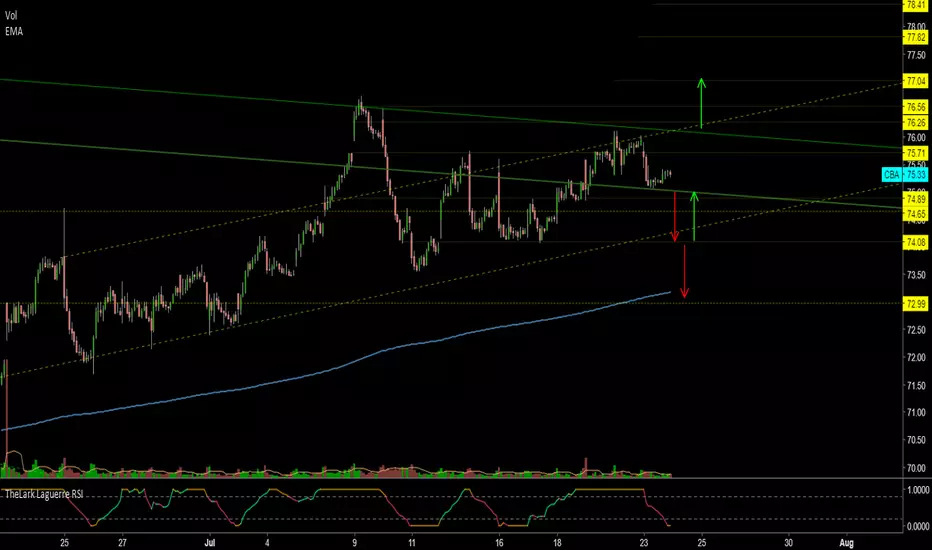
CBA Trade AnalysisCBA bounced at the support trend line around 74.89 and closed today's session at 75.24 down by - 0.87%.
Future Support and resistance estimates are marked on the chart
$CBA ST weakness in bullish patterngeneral analysis at this stage watching for potential setup.
See annotations

CBA short-Huge 9 year pattern
-Lower boundary tested many times with out of line moves
-Established medium term downtrend
-50SMA is firmly below 200 SMA weekly
-Daily retest of underside of horizontal boundary friday close
-Measured move down to 44.37
30 basis points of risk
Could prove quite difficult to trade such a large pattern. If I am stopped out, will wait for a continuation pattern to get short again

CBA - Time for an accumulation?The price has been falling since early 2017 from the peak around $88.00.
This drop has been a "healthy" one as we are seeing this as a correction for a longer term accumulation to the upside.
Some quick fundamentals to support the upside -
1) Revenue has been increasing for the past 5 years;
2) Net income has been increasing for the past 5 years;
3) Dividends have been increasing for the past 5 years;
4) FCF has been fluctuating up and down, but has greatly increased for the TTM; and
5) Net margin has been increasing for the past 5 years.
On the technical side of analysis, $66.50 to $68.62 present a very decent area for accumulation, potentially towards $75.59 and $77.23.
We are looking at this setup as a potential dividend play trade as well, which mean we are interested to hold on to this trade for a longer term.
**This analysis alone DOES NOT warrant a sell trade immediately. Before you enter any trade in the financial market, it is very important that you have a proper trading plan and risk management approach.
The sharing of this idea is neither necessarily indicative of nor a guarantee of future performance or success.

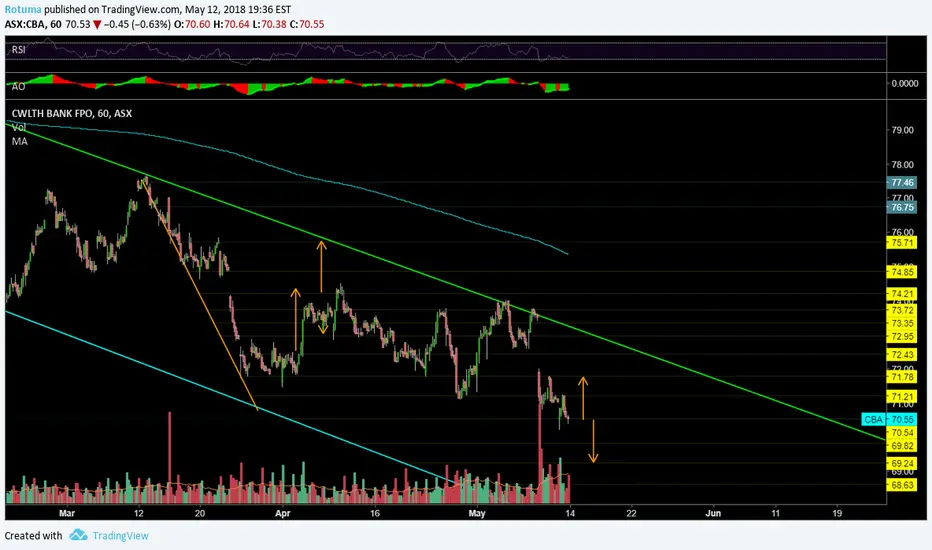
CBA - short to medium term share price forecastThis is an update of my original chart created at the beginning of March 2018.just added extra support and resistance to the chart.
There were some interesting moves to the upside towards the end of April 2018, I was monitoring closely for a signal of changes to the direction of price movement as volume and momentum serged to the upside in hope of breaking out of the downward price channel. unfortunately, share prices had two failed attempts and gapped down on 9th of May 2018. Share prices closed the last trading session in the middle of the price channel at 70.53 down by -0.63%.
Share prices need to hold the current support at around 70.54 before any attempts to get back up to the top of the price channel at around 71.21 and 71.28. Failure could see prices fall to the next two support at around 69.82 or 69.24. There are other support and resistance marked on the chart for future references.
The Big Leverage - lookin for a big yellow, in 6 inch stilettos Support $70
Bank housing loan book performance worst since the GFC
looks heavy AF, 10% gross yields might provide some support.
Plenty cockroaches in the kitchen from Money Laundering to Fraud, negligence and market manipulation
I will be shorting "The Big Leverage" until Sydney property bottoms out.

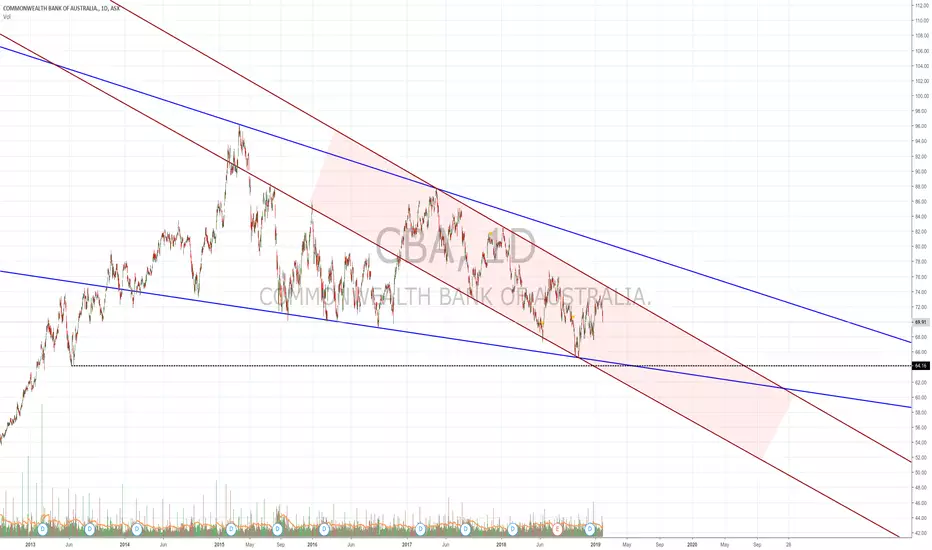
Bearish on CBAI think the broader market cycle for CBA has reached it's highs and unless we break above $88 we're probably going to drop down to the $48 -$52 zone. The last 3 monthly candles look bearish.


CBA / ASX entering the long waited bear market, keep an eye on Following S&P correction, the biggest weigh on Australian index is triggering a nicely formed head and shoulders pattern on the daily, ideal short would be when it pullback, if it does

CBA Set to Take Breather?The forecast for Commonwealth Bank stock prices is steadily higher through to the end of December, however, it looks like a very short-term consolidation or even pull-back is likely. The ideal buying opportunity is shown in the chart when the oscillator is bright green as this oscillator is always green when the stock makes a medium-term low. When the oscillator turns bright red it typically signifies a short-term high in the next few days and an opportune time to sell a call option, in expectation of either a slowing of momentum or slightly lower prices. Based upon the analysis it would appear prudent to await a better buying opportunity than what is currently shown.


Easy on CBAIf you were shorting CBA this week, FT Pivots would give you excellent reference points for the trades

CBA Short Term TradeThis is a test recommendation for ASX:CBA .
CBA has been trading sideways causing the ADX indicator to reach a low level. This is indicative for the beginning of a new trend. With dividends being paid in late Feb an upside breakout is probably more likely.


CBAUF - Commonwealth Bank of Australia -25% since MayCommonwealth Bank of Australia (ASX: CBA)
There are some factors that affect CBA
Recent downturn in Australian econmy, with the decline of ASX. Australia’s largest bank joined bear market.
Housing market is reaching peak, house price is going back more afforable, home loan is a main part of Monopoly Banking game.The banking regulator has forced major banks to slow down their residential investor lending (by increasing investor interest rate). www.investopedia.com
Dividend yield now is less attractive which means less buyers.
Comment: at this market condition, expecting share price continues decline till the year end.
Note: TA analysis on chart
Thank you for your reading.
MichaelTran
