#COMI - ACTION IN THE WAY - all market will rising soon or ??!!EGX:COMI is showing a potential triangle pattern.
BB support is at 79.15, making it a good entry point for a long position.
Prices are currently trading below the middle BB line (80.16), which has acted as resistance since the start of the month.
As long as prices stay above 78.60, they are likely to reach 83.20 eventually.
At June market may go to moon , just remember who told you first .
But still be caution more than optimistic or hopeful
At this point market may achieve new historical levels from anther hand EGX30 tray many times to close over 32200 but is failed.
No one is bigger than the market and remember Technical analysis is not an accurate science .
This is not financial advice, just our analysis based on chart data. Please consult your account manager before investing.
Thanks and good luck!
CIBEY trade ideas

COMI needs to break out of the channel to reach the next target.The price is currently facing channel resistance at 79.8. If it breaks above this level, the initial target is the strong resistance at 84. From 84, the price might pull back to retest the 79.8 level. If 79.8 holds as support and buying pressure is strong, the subsequent target would be 96.

COMI Egypt can exceed 104 in 6 monthsWeekly chart,
The stock EGX:COMI has formed a symmetrical triangle chart pattern, and crossed the Resistance line R.
One more week above R, to confirm, the target will be 104.3 - passing through several resistance levels as shown on the chart.
A new entry (buy) can be made immediately before confirmation with higher risk, and consider a stop loss below 76.0
Technical indicators RSI and MACD are positive.
NOTE: Keep a near Profit Protection/ Stop Loss level.

Emerging Bearish harmonics Scalping long trade to the completion of the emerging Bearish harmonic patterns the Bearish move on the breakout of the trend line

Commercial International BankThe stock of Commercial International Bank (CIB) on the Egyptian Stock Exchange: please exercise caution. The stock had been rising from September 2022 to its peak in March 2024, where it made a false breakout above the last peak. It then dropped to the channel's lower limit on April 30, 2024, and attempted to rise to form a new peak, but failed. A confirmation of a trend break on the weekly timeframe occurred with a close outside the channel on October 13, 2024. Since then, the price has been outside the channel.
The first negative signal occurred when the small green trend was broken after the price left the channel. Secondly, the price formed a descending red trend, as shown. Thirdly, there is clear divergence in the price movement on the green trend in the smaller time frame (1-hour) with both the MACD and RSI indicators. A strong exit signal occurred on November 14, 2024, when the price hit a strong cluster area, as shown in the chart.
For short-term traders, the target is a decline to a lower low below 76 EGP. We also expect the price to break the correction's bottom at 70.50 EGP. At this point, medium-term investors should consider exiting. A large head-and-shoulders pattern is likely to form, along with harmonic patterns, with initial targets between 52.66 EGP and 52.43 EGP, followed by another target range between 42.23 EGP and 42.90 EGP. It Is my vision , not a recommendation for buying or selling.

Comi Important Levels - GannHello Dear Traders,
Decrypting The Algos!
- Important Levels
On the Chart "Horizontal Lines" Based on Gann Square of 9
Works as Support/Resistance. Watch for Price action around those levels
- Jinny Gann Grid
- Vertical lines works as time lines. Expect Reversal around them.
Next Near Resistance:84.07 Then 89.9
Near Support : 78.37 Then 72.87
How to Read the Chart?
Zoom in to Current Price! and see where is the support and resistance on that date you checking the chart ;)
Wish you Best of luck

CIB 84 target "overbought"with reference to RSI and resistance level 84 EGP is an overbought signal, even we are in uptrend I would say to CIB stock holder to reduce and out @ 84
the re entry level is 78
Buy only with 10% of your wallet @78 if price fall increase at 73 level
note the recommendation for medium term only and swing treader with target 10%
at 86
**this is not an advice to buy or sell

medium term CIB is down trendin daily perspective we are in counter up trend will low momentum. with to strong resistance 77 and 80
the price in range between 70 minimum and max 84 EGP
I would say buying level is 70 with target 82
if breaker 70 I will again buy at 65 level and hold
recommendation
no entry now waiting for 70 EGP
if reach will buy 5-10% of my account
if 70 level broken will buy at 65 with 5-10% of my account
and hold

Day Trade for COMI- ONLY if all stars are aligned.
- Resistance @ 75.70- 76.40, if the market is able to breakout these levels, high probability that CIB will at least poke 78.70.
- Day trading is highly risky, risk only what you can afford to lose.
- Bearish market cancels the trade.

Possible harmonic patterns Two scenarios for bullish and bearish outlook are shown in the chart.
Wait for price action at potential reversal zone

Multi timeframe analysis weekly, two days, daily, hoWeekly, 2 days, and daily timeframes are still uptrending. Unfortunately, there are some hiccups on lower timeframe. The five minute timeframe suggests that we are consolidating below red kumo.
Analysis is based on Ichimoku, and Elliot waves. Confirmation is done by other indicators such as MACD, stochastic RSI, OBV, and RedK Everex.
Watch the video idea to have the full picture of the stock under analysis.
Disclaimer:
The Content is for informational purposes only, you should not construe any such information or other material as legal, tax, investment, financial, or other advice.
There are risks associated with investing in stocks, and might involve risk of loss. Loss of principal is possible. Investors should note that past performance is not a guarantee of future returns. The investment value may be affected by market fluctuations.
The stocks mentioned here are not equivalent to, nor should it be treated as a substitute for, time deposit or any other form of saving deposits.
Investment in the securities of smaller companies can involve greater risk than is generally associated with investment in larger, more established companies that can result in significant capital losses.

Setting-up your trading plattform5 Indicators :
LUXALGO
a-Adaptive MACD
b- MACD based price forcasting
DGT:
a-Price Action Support & resistance
b- ˜Dual Supertrends
REDKTRADER
a-REDK EVEREX
Narrative is in Arabic

Ras Hikma impact on EGX30the rule of thumb in the EGX30 ... buy on RUMOURS, and sell on the NEWS.
Rumors started on Jan 31st, Ras Hikma project is worth 45Bn USD, and Emiraties areIN.
Yesterday, the Rumors became solid fact, Egypt prime minister announced the signing of the contractual agreement live on national television.
The deal is worth 35Bn USD.
The USD/EGPp on investing.com dropped almost 19%.
However, the market sentiment is the key success factor for every single stock.
A repeat scenario of January 31st probabilities are above average.

CRITICAL POINT = 81.8-82.1EGPMAKE IT OT BREAK IT ...
FVG @81.8-82.1EGP is the breaking point to go long or short
FOREX IS A VIRTUE
COMI is THE key driver for EGX30, its weight is almost 30%, followed by the Fertilizers sector (MFPC & ABUK).
When COMI outbreaks, Ferts are SHY.

COMI ending correction & starting consolidation MTF, COMI ending correction & starting consolidation
Price Channel 84.5 - 79.5 ; Equilibrium 81.9EGP
Take position @ lower end of price channel

CIB ending correction CIB ending correction with one green Bar on a daily timeframe.
Target setting on 1 hour timeframe
Market entry on 5 minutes timeframe
Suggested Buy position @ 79 EGP
Stop Loss @ 78 EGP
Take profit @ 84.5EGP
Disclaimer:
The information and publications are not meant to be, and do not constitute, financial, investment, trading, or other types of advice or recommendations. it is just for education purpose.

COMI is Risky to buy or hold now- do your own research but I personally consider COMI a risk off.
- technicals are not in favor of a continuation.

correction movement in Correction Phase ... short erm
still uptrending for mid-term & long-term investors

Chikou span facing downwardTechnical Analysis for intraday 5/2/24
Correction & Plateau; KUMo formation is very thin.
conservative outlook with 2% gain.
volume 5M below average 8M
Overall COMI is still uptrending, and trading above trend mid point.

Commercial International Bank (COMI) opportunity Seizing intraday opportunity based on Smart Money Integrated with Ichimoku Kinko Hyo + FVG.
The narrative is channeled toward Arabic speakers trading in CASE.
Disclaimer: My analysis is not an investment proposal; Please consult your Investment Advisor and/or your Wealth Manager for your investment decisions.

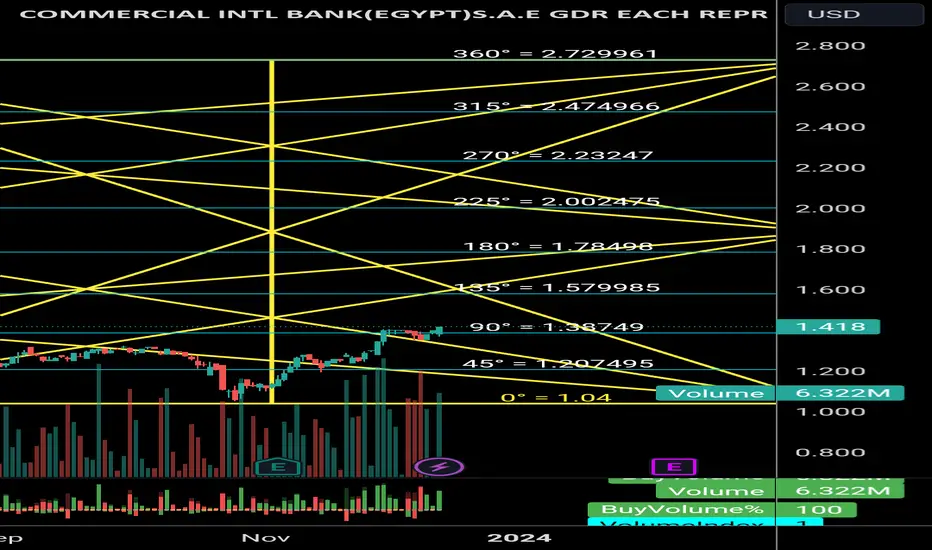
CbkdJinny gann star
Gann square of 9
Support and resistance levels
Possible top at 2.72
Support at 1.38
Good luck
Get on board Cib The aeroplane will fly to 100 next daysAs we can see after end of correction of Elliot waves, tomorrow will be critical for the target of 100egp

CIB to target 100Weekly chart, the stock is forming a parabolic pattern, to target 100 after crossing 87
BE CAREFUL: Stop loss level should be raised at every up movement.
