$EEGI Readies Itself As it Gets Close to Acquiring OTCIQ PT .25+$EEGI's CEO recently tweeted that the company was very close now to acquiring OTCIQ Access and uploading documents. The process has been slowed down tremendously by FINRA's new regulations that will take effect in September.
The CEO is actively engaged and seems to have formulated a game plan for
−32.88 K USD
0.00 USD
8.27 B
About Eline Entertainment Group, Inc.
Sector
Industry
CEO
Shing Hei Lee
Headquarters
Hong Kong
Founded
1997
FIGI
BBG000DJDVB8
Eline Entertainment Group, Inc. engages in the production and distribution of sports and entertainment. It intends to cover media outlets such as live broadcasts, movies, PPV events, closed circuit simulcasts, and streaming content. The company was founded on June 12, 1997 and is headquartered in Hong Kong.
Related stocks


EEGI Chart AnalysisUpon review bullish divergence can be seen when combining rsi with price action, divergence happened within rsi making it a better trade
reverse merger official. this will be in pennyland in no time. almost 3 bill shares traded. we got the heavy hitters like Alex delarge tweeting all over about it.

$EEGI Launches New Website A/H's After Consolidation PT .15+$EEGI Which has been on a tear lately has been compared to $LTNC $TSNP $ENZC $HQGE and for good reason. The company has a plethora of verifiable DD and A/H's Friday dropped a recent bomb, which included a very sleek brand new website that will go hand in hand with its upcoming catalysts.
For more D

EEGI Chart AnalysisUpon review bullish tight divergence can be seen following an uptrend
may still have more room to grow, 20 sma is coming back up over 200, If done this will indicate trend change
The Barchart Technical Opinion rating is a 96% Buy with a Strongest short term outlook on maintaining the current direc

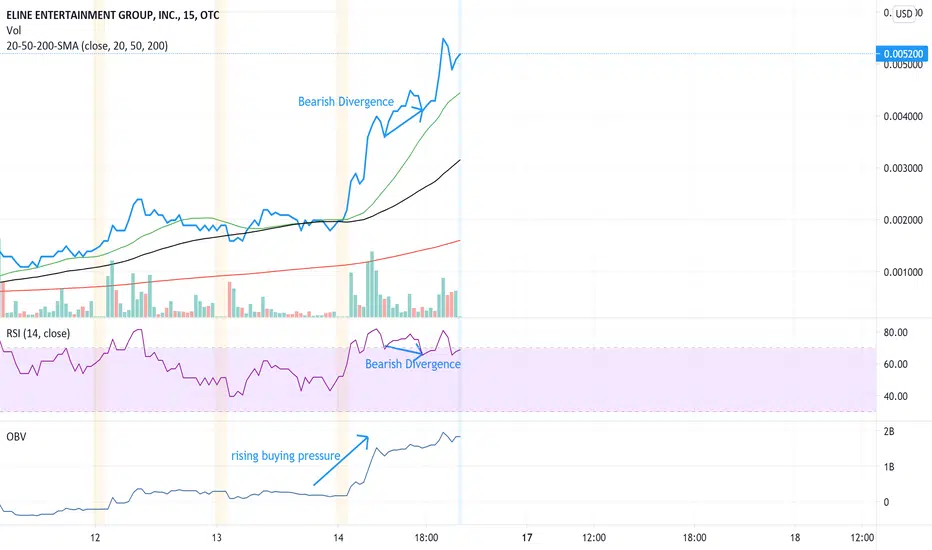
EEGI Chart Analysisupon review tight bearish divergence can be seen following a downtrend.
if price drops more expect an increase of buying pressure and a rebound in price Grade A stock in my opinion
just the beginning of this massive move in my opinion.
price is hugging 20 sma, 200 is still great support.

EEGI Chart Analysisupon review bearish divergence is sighted
buying pressure is rising and volume is increasing
200 sma is perfect support and price action is is above 20 sma great sign
Barchart doest have a chart analysis, get in early maybe
EEGI is on fire right now and I don't see it slowing down anytime soon.
$EEGI Has the Potential to Be the Next $LTNC $HQGE $HMBL $EEGI A recent gem that has captivated OTC traders lately has seem some tremendous growth this past week. And for good reason.
Similar OTC Stocks have seen a boom in trading activity since the start of the year and many with gigantic share structures have ran sky high. Several examples of these ar

Looking for a breakout $EEGISlight trend upward with periodic 2nd and 3rd main waves breaking out of channel. Looking for a breakout with updates soon to be delivered

See all ideas
Summarizing what the indicators are suggesting.
Oscillators
Neutral
SellBuy
Strong sellStrong buy
Strong sellSellNeutralBuyStrong buy
Oscillators
Neutral
SellBuy
Strong sellStrong buy
Strong sellSellNeutralBuyStrong buy
Summary
Neutral
SellBuy
Strong sellStrong buy
Strong sellSellNeutralBuyStrong buy
Summary
Neutral
SellBuy
Strong sellStrong buy
Strong sellSellNeutralBuyStrong buy
Summary
Neutral
SellBuy
Strong sellStrong buy
Strong sellSellNeutralBuyStrong buy
Moving Averages
Neutral
SellBuy
Strong sellStrong buy
Strong sellSellNeutralBuyStrong buy
Moving Averages
Neutral
SellBuy
Strong sellStrong buy
Strong sellSellNeutralBuyStrong buy
Displays a symbol's price movements over previous years to identify recurring trends.
Frequently Asked Questions
The current price of EEGI is 0.0004 USD — it hasn't changed in the past 24 hours. Watch Eline Entertainment Group, Inc. stock price performance more closely on the chart.
Depending on the exchange, the stock ticker may vary. For instance, on OTC exchange Eline Entertainment Group, Inc. stocks are traded under the ticker EEGI.
EEGI stock hasn't changed in a week, the last month showed zero change in price, over the last year Eline Entertainment Group, Inc. has showed a 100.00% increase.
EEGI reached its all-time high on Jul 30, 1999 with the price of 7,986.0712 USD, and its all-time low was 0.000001 USD and was reached on Jul 20, 2017. View more price dynamics on EEGI chart.
See other stocks reaching their highest and lowest prices.
See other stocks reaching their highest and lowest prices.
EEGI stock is 33.33% volatile and has beta coefficient of −112.19. Track Eline Entertainment Group, Inc. stock price on the chart and check out the list of the most volatile stocks — is Eline Entertainment Group, Inc. there?
Yes, you can track Eline Entertainment Group, Inc. financials in yearly and quarterly reports right on TradingView.
EEGI net income for the last quarter is −8.54 K USD, while the quarter before that showed −13.26 K USD of net income which accounts for 35.57% change. Track more Eline Entertainment Group, Inc. financial stats to get the full picture.
No, EEGI doesn't pay any dividends to its shareholders. But don't worry, we've prepared a list of high-dividend stocks for you.
As of Jul 22, 2025, the company has 4 employees. See our rating of the largest employees — is Eline Entertainment Group, Inc. on this list?
Like other stocks, EEGI shares are traded on stock exchanges, e.g. Nasdaq, Nyse, Euronext, and the easiest way to buy them is through an online stock broker. To do this, you need to open an account and follow a broker's procedures, then start trading. You can trade Eline Entertainment Group, Inc. stock right from TradingView charts — choose your broker and connect to your account.
Investing in stocks requires a comprehensive research: you should carefully study all the available data, e.g. company's financials, related news, and its technical analysis. So Eline Entertainment Group, Inc. technincal analysis shows the strong buy rating today, and its 1 week rating is buy. Since market conditions are prone to changes, it's worth looking a bit further into the future — according to the 1 month rating Eline Entertainment Group, Inc. stock shows the neutral signal. See more of Eline Entertainment Group, Inc. technicals for a more comprehensive analysis.
If you're still not sure, try looking for inspiration in our curated watchlists.
If you're still not sure, try looking for inspiration in our curated watchlists.