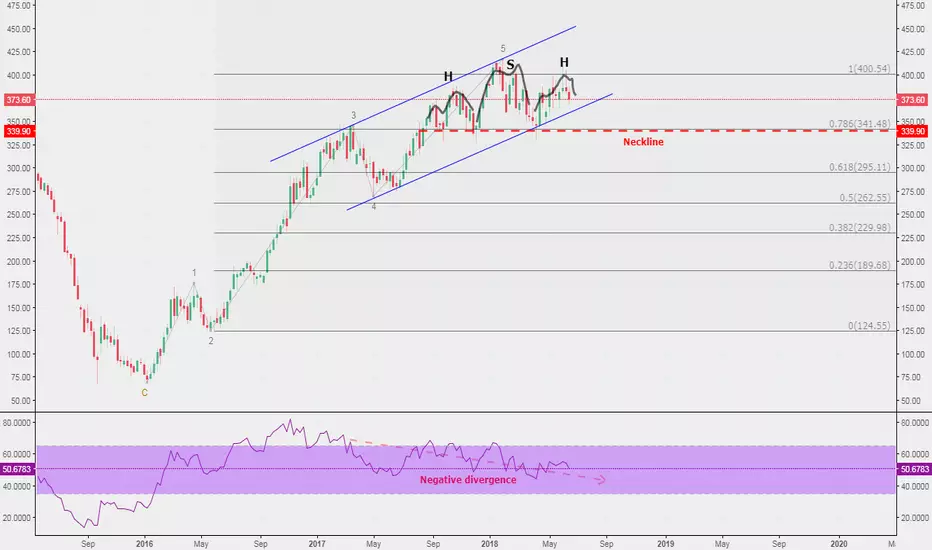
#GLEN comment: H&S formation is intact, fall pressure increases#GLEN topped in the beginning of this year but since then the price rally lost its power though the company announced better results compared to the previous year.
Technically, the share builds a H&S formation, which has a neckline around 339. If this level is passed down then there may be further fall, which can be interpreted as a correction (ABC) formation.
This is not financial advice!!! Do not make financial decisions based on this analysis.
GLNCY trade ideas
Glencore in freefall Glencore shares are in freefall this morning as the US department of justice hands the company a subpoena in relation to money laundering. The company has been has been asked to hand over records to the US DoJ so they can look into activities in Nigeria, the Democratic Republic of Congo and Venezuela dating ranging as far back as 2007
Looking at the chart you can see there was a significant fall, at one stage the company was suspending from trading.

GLEN - Potential FormationLooking at the daily chart we have two interesting formations that could indicate a short term upswing. Indicators also seem to be slightly diverging to price.
We have a potential 'Wolfe Wave' and Cypher pattern. Wolfe wave price target of around 420 with projection time being Ex-Div date. The cypher target would be 395.

Inverted H&S in Glencore D1CHXEUR:GLENL is showing a possible inverted H&S in D1 time-frame, that could be in line with Monthly trend continuation on the long
please let me know your comments.............

Glencore $8GC $GLEN updateGlencore - 8GC
Next resistance around 4.80 region.
I stay bullish and keep everything while it stays in the blue chanel.

#GLEN (LSE) - Glencore - BuyLooking at a buy entry from 340.
Financials looks good. From a technical standpoint the RSI/Stoch are both oversold and price has rejected strongly from the 200ma forming an outside day bar.
I'll run a pretty tight stop at 320.
TP at previous high of 388.

Glencore ~ Long Swing Trade Bullish swing is commencing.
Hold till resistance level/overbought RSI
Place stop loss at 345
Risk/reward ratio: 6

GLEN: Glencore is in a strong uptrendI'm long $GLCNF/$GLEN here. I like the outlook for Cobalt, as the EV race intensifies. Supply of this metal is constrained, and as demand surges, prices will follow, intensely.
With some luck, I'm correctly calling the bottom of this pullback, which gives us a low risk to join this trend. I'm already positioned from lower levels in $VALE, and also in $BHP, and $GLEN was the missing piece for my portfolio that gravitates around this and other themes currently.
Best of luck if joining me here,
Cheers.
Ivan Labrie.

Glencore a prime example of volume profile strengthI wanted to use this chart as an example of how useful market profile is!
Just below the 340 area you can see the main value area on the volume profile indicator.
In conjunction with the candle action you can see that area was rejected with some power.
Once the candle high was broken the approach to new highs was made.


Glencore long term shortPotential area of reversal for Glencore. With expectations of low inflation, high leverage so exposed to interest rates and an reversal pattern in the making, this may be worth the shot short.

End of wave 3 for Glencore?Calling tops is a tricky business and wave 3 may well have further to run but this count shows a possible top of wave 3 with the possibility of a wave 4 correction and 5th wave to come.

Glencore - textbook topping patternThe daily chart shows a textbook topping pattern… here is the sequence –
Bearish RSI divergence
Breach of the rising trend line followed by sideways action
Bearish breakdown of sideways channel &
Now a falling channel
Looks like the share price is set to take out support at 292 and test the falling channel floor around 282 levels.

Glencore looks set to leave a lower top formationThe bearish divergence as is shown by the falling channel on the RSI, coupled with the fact that 50-DMA has topped out suggests the stock is more likely to leave a lower top formation followed by a bearish break from the sideways channel floor seen at 308.30. Such a move would open up downside towards 277 levels (target as per the measured height method).
On the higher side, only a daily close above the 50-DMA would revive bullishness.


Glencore did not close above prev highTwo scenarios:
1. retrace find support then go higher
2. continue to go higher, place order above the high of last week's candle


UK STOCK, GLENCORE, D1/MN SHORTPrice hit MN Supply zone and on D1 chart created new D1 Supply zone with potential do go short.

