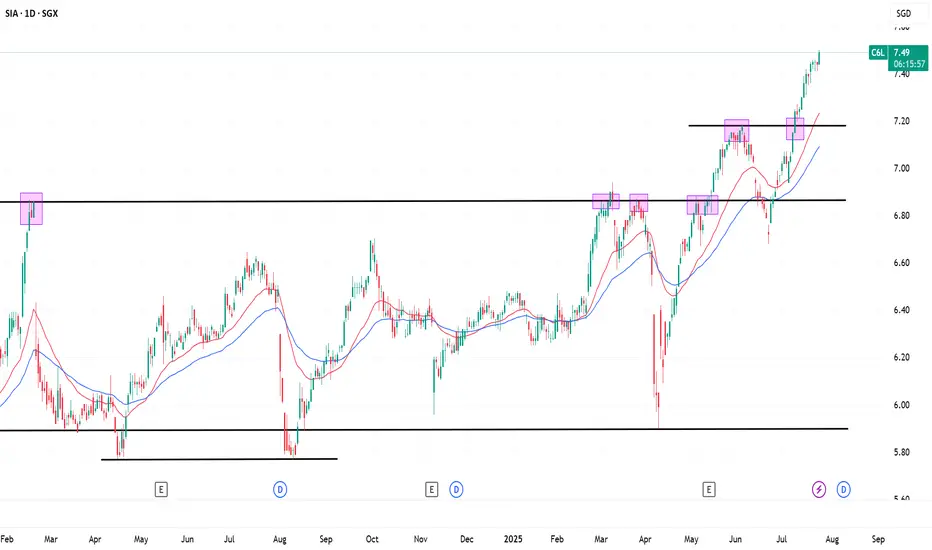
SIA – Unstoppable MomentumBroke past the key 7.20 resistance after twice rejections.
Now SIA is heading toward the next target at 7.84 no major resistance in sight.
Next report date
—
Report period
—
EPS estimate
—
Revenue estimate
—
0.70 USD
2.07 B USD
14.54 B USD
1.40 B
About SIA
Sector
Industry
CEO
Choon Phong Goh
Website
Headquarters
Singapore
Founded
2009
ISIN
SG1V61937297
FIGI
BBG000BY1XH0
Singapore Airlines Ltd. engages in the provision of passenger and cargo air transportation services. It operates through the following segments: Full-Service Carrier, Low-Cost Carrier, Engineering Services, and Others. The Full-Service Carrier segment includes Singapore Airlines brand with a focus on full-service passenger serving short and long-haul markets. The Low-Cost Carrier segment focuses on the Scoot brand serving low-cost passenger markets. The Engineering Services segment provides airframe maintenance and overhaul, line maintenance, technical ground handling, and fleet management services. The Others segment is involved in tour activities and selling merchandise. The company was founded on January 28, 1972 and is headquartered in Singapore.
Related stocks
SIA Testing $6.86 Resistance Ahead of 15 May EarningsSingapore Airlines (SIA) is testing a key resistance at $6.86 as it gears up to announce its full-year results on 15 May. The drop in oil prices could give the company a boost with better margins.
If it breaks above $6.86, we might see more upside. But if it fails, a short-term dip over the next 7

SIA Hits Resistance at SGD 6.86SGD 6.86 is a key resistance level for SIA. A successful breakout could see it turn into support. Failure to break above this level suggests continued short-term downside.

Singapore Airlines (SIA) Finds Support at 5.87 After Recent DownSingapore Airlines (SIA) has experienced a notable downturn in its share price over the past weeks, reflecting broader market concerns and a prevailing negative sentiment. After this period of decline, the stock is now finding support around the 5.87 level.

We are back!! $SIA(C6L.SI) Showing sign of bottomHas been away awhile from here! Hope everyone is doing well in the stock market! Let's dive into our analysis on SIA C6L
Recent fall shows signs of volume supporting the price at the previous low in the 5 mins chart (yellow box).
With price moving slightly higher could be a sign of short term reb

SIA shows sign of price peakRecent rebound in SIA shows multiple high volume in 5 mins chart yesterday with limited price up.
This indicates the big boys are churning at the high price to creates Fear-Of-Missing-Out to retail investors to place order in.
When there are enough buyers at the lower pricing, the big boys will s

Singapore Airlines - An amazing set-upNothing much to say. If you don't know SIA, then forget this and move on.
If you know what SIA is, this opportunity should not be missed.
Amazing set-up , great risk reward.

Singapore Airlines (SIA : C6L) targets $7.00 and attempts to breLong term DOWNTREND SINCE 010908
Medium term UPTREND since 111021
Short term UPTREND since 311022
Singapore Airlines is 1 of 8 component stocks supporting the rise of the STI at the start of 2023.
The long signal for this recent run started on 311022 at the price of $5.21.
$7.00 is a significant

Rejected at 200. consolidation for a while ?Rejected at support.
Will fill the gap before moving on.


See all ideas
Summarizing what the indicators are suggesting.
Neutral
SellBuy
Strong sellStrong buy
Strong sellSellNeutralBuyStrong buy
Neutral
SellBuy
Strong sellStrong buy
Strong sellSellNeutralBuyStrong buy
Neutral
SellBuy
Strong sellStrong buy
Strong sellSellNeutralBuyStrong buy
An aggregate view of professional's ratings.
Neutral
SellBuy
Strong sellStrong buy
Strong sellSellNeutralBuyStrong buy
Neutral
SellBuy
Strong sellStrong buy
Strong sellSellNeutralBuyStrong buy
Neutral
SellBuy
Strong sellStrong buy
Strong sellSellNeutralBuyStrong buy
Displays a symbol's price movements over previous years to identify recurring trends.
SINGY5137538
Singapore Airlines Limited 3.0% 20-JUL-2026Yield to maturity
4.70%
Maturity date
Jul 20, 2026
SINGY5808290
Singapore Airlines Limited 5.25% 21-MAR-2034Yield to maturity
4.70%
Maturity date
Mar 21, 2034
SINGY5391269
Singapore Airlines Limited 3.375% 19-JAN-2029Yield to maturity
4.69%
Maturity date
Jan 19, 2029
XS226002529
SINGAP.AIRL 20/25 CVYield to maturity
−81.28%
Maturity date
Dec 3, 2025
See all SINGF bonds
Frequently Asked Questions
The current price of SINGF is 5.30 USD — it has decreased by −2.75% in the past 24 hours. Watch Singapore Airlines Ltd. stock price performance more closely on the chart.
Depending on the exchange, the stock ticker may vary. For instance, on OTC exchange Singapore Airlines Ltd. stocks are traded under the ticker SINGF.
SINGF stock has fallen by −9.40% compared to the previous week, the month change is a 1.15% rise, over the last year there was no change in Singapore Airlines Ltd. price.
We've gathered analysts' opinions on Singapore Airlines Ltd. future price: according to them, SINGF price has a max estimate of 5.43 USD and a min estimate of 4.27 USD. Watch SINGF chart and read a more detailed Singapore Airlines Ltd. stock forecast: see what analysts think of Singapore Airlines Ltd. and suggest that you do with its stocks.
SINGF reached its all-time high on Oct 11, 2007 with the price of 13.95 USD, and its all-time low was 1.35 USD and was reached on Mar 13, 2008. View more price dynamics on SINGF chart.
See other stocks reaching their highest and lowest prices.
See other stocks reaching their highest and lowest prices.
SINGF stock is 2.83% volatile and has beta coefficient of 0.92. Track Singapore Airlines Ltd. stock price on the chart and check out the list of the most volatile stocks — is Singapore Airlines Ltd. there?
Today Singapore Airlines Ltd. has the market capitalization of 15.92 B, it has increased by 2.17% over the last week.
Yes, you can track Singapore Airlines Ltd. financials in yearly and quarterly reports right on TradingView.
Singapore Airlines Ltd. is going to release the next earnings report on Nov 13, 2025. Keep track of upcoming events with our Earnings Calendar.
SINGF net income for the last half-year is 1.52 B USD, while the previous report showed 577.20 M USD of net income which accounts for 162.51% change. Track more Singapore Airlines Ltd. financial stats to get the full picture.
Singapore Airlines Ltd. dividend yield was 5.89% in 2024, and payout ratio reached 44.78%. The year before the numbers were 7.50% and 75.88% correspondingly. See high-dividend stocks and find more opportunities for your portfolio.
EBITDA measures a company's operating performance, its growth signifies an improvement in the efficiency of a company. Singapore Airlines Ltd. EBITDA is 3.08 B USD, and current EBITDA margin is 21.16%. See more stats in Singapore Airlines Ltd. financial statements.
Like other stocks, SINGF shares are traded on stock exchanges, e.g. Nasdaq, Nyse, Euronext, and the easiest way to buy them is through an online stock broker. To do this, you need to open an account and follow a broker's procedures, then start trading. You can trade Singapore Airlines Ltd. stock right from TradingView charts — choose your broker and connect to your account.
Investing in stocks requires a comprehensive research: you should carefully study all the available data, e.g. company's financials, related news, and its technical analysis. So Singapore Airlines Ltd. technincal analysis shows the sell today, and its 1 week rating is buy. Since market conditions are prone to changes, it's worth looking a bit further into the future — according to the 1 month rating Singapore Airlines Ltd. stock shows the buy signal. See more of Singapore Airlines Ltd. technicals for a more comprehensive analysis.
If you're still not sure, try looking for inspiration in our curated watchlists.
If you're still not sure, try looking for inspiration in our curated watchlists.