6/ Altseason: Live - Is this really the Altseason?12day Result I know this is the exact question you're asking yourselves as you look at your portfolios. "What altseason? Everything is flat."
Maybe I was wrong two weeks ago when I said it had already started. But, as they say, the result speaks for itself.
12 days ago, as part of the Altseason Live challenge, I started with $10k . Today, the account is at $35k .
Let's break down what's really happening, and why your feeling of having missed out is an illusion.
You are absolutely right in your observations. If we look at most coins, we'll see that they are still at the very bottom. They haven't even begun their main move yet.
Below are random strong projects of the industry
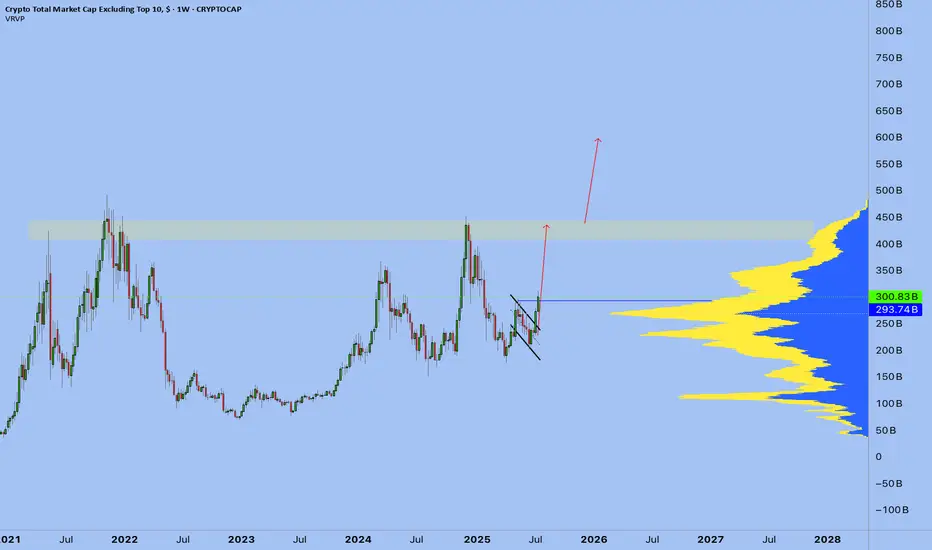
Here is the visual proof. This isn't a "dumping" market. This is a market that is accumulating energy. And that's the best possible news for anyone who thinks they've missed out. The main, most powerful wave of growth that will lift all these coins hasn't even started.
My result wasn't achieved through general market hype, but through surgical, precise trades. I used my coin-picking strategy (which I wrote about in Post 2/ Altseason: Live - My Coin-Picking Strategy) -focusing on projects that play by their own rules. I continue to do deep research and enter every position with surgical precision.
Why August Will Be Incredible. The Calm Before the Storm.
What we are seeing now is the classic calm before the storm. Most market participants don't understand what's happening and are in a state of confusion. But if you look closely, you can see that many projects have already completed their accumulation phase. An immense amount of power is building up under the hood of the market.
I believe that August will be the month when this energy is unleashed. It will be the month that kicks off the explosive, broad movement that everyone is waiting for. And that is exactly why now is the most crucial time. It's not a time for FOMO, but for level-headed preparation.
So, knowing all this, what do we do next?
First, we don't panic. We understand that the main train is still at the station.
We keep hunting for strength. My strategy of finding strong projects remains unchanged.
We use every correction as a gift. Any 15-25% dip on a promising asset is an opportunity, not a catastrophe.
We prepare for August. The next month could be the defining one for this entire cycle.
My result proves that opportunities always exist, even in a "sleeping" market. And for complete transparency, all proof of my trades is broadcasted on streaming platforms. The real fun, the altseason we are all waiting for, is still ahead. Stay focused.
Best regards EXCAVO
OTHERS trade ideas

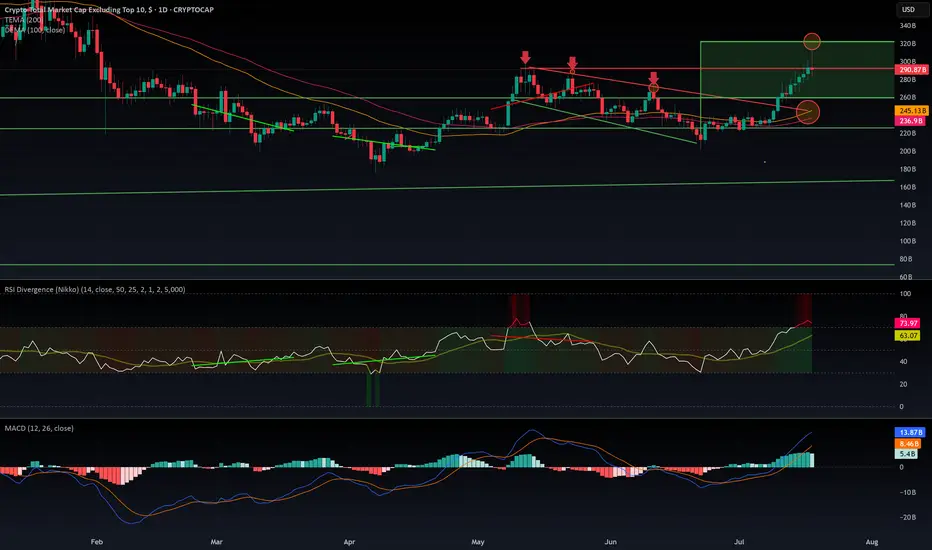
$OTHERS rejected from $320 B resistance. What is next?CRYPTOCAP:OTHERS Rejected at $320B: Is the Altseason on Pause?
CRYPTOCAP:OTHERS just got rejected at the $320B resistance after a decent pump — the kind that usually signals the start of an altseason. But if we dig into the indicators, warning signs are flashing:
- MACD is sitting in overbought territory.
- RSI is heavily extended, signaling potential exhaustion.
- EMA 100 & 200 are colliding with the top of a previous downtrend channel — a zone that historically acted as strong resistance.
The rejection was sharp. So what's next? Are we entering a range between $320B and $260B? It's quite possible. The aIf you wantltcoin market now sits at a decision point: either it keeps pushing higher or takes a breather — potentially pausing the rally until September.
Historically, August is a slow month in the West. People go on vacation, volumes drop, and markets tend to cool off. This seasonal pattern supports the idea of a consolidation phase before a stronger second leg of altseason kicks off in mid-September and carries into Q4.
I’m not posting too many ideas lately because the market landscape has changed. The new players aren’t just trading — they’re manipulating flows with massive capital to hunt retail liquidity.
They’re also using far more sophisticated tools than our classic MACD and RSI — including AI-powered indicators and multi-layered analytics that are beyond retail reach.
In this new environment, predictions are harder and risk is higher.
🧠 Do Your Own Research (DYOR), stay sharp, and don’t blindly trust social influencers.
others \ btcOthers bitcoin pair has found support from the rising trend line since 2016 2017 and continues to recover

Altseason 2025 – EthseasonWe’ve officially entered #ETH season. Some liquidity is flowing into alts, but CRYPTOCAP:ETH has now taken the lead from CRYPTOCAP:BTC as the big dog.
Old retail is here and slowly buying this dip... but the new retail is nowhere to be seen, yet! Still positioning for that full-blown altseason:
🥑 POLONIEX:GUACUSDT 🧱 MEXC:YBRUSDT ⛏️ MEXC:KLSUSDT
🌐 HTX:SYNTUSDT 🧪 MEXC:DEAIUSDT ✳️ MEXC:SAIUSDT
🔗 POLONIEX:LLUSDT 🎮 KUCOIN:MYRIAUSDT 🤖 COINEX:ENQAIUSDT
#crypto #altseason2025 #altseason #ethseason

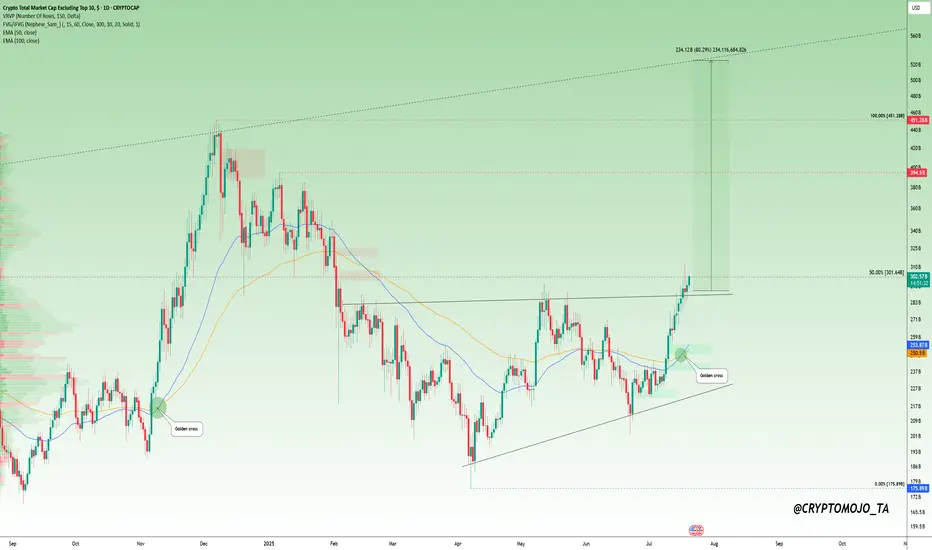
Altcoins Waking Up? Here’s What the Charts Are Telling Us!Altcoin Watch: Momentum Is Building!
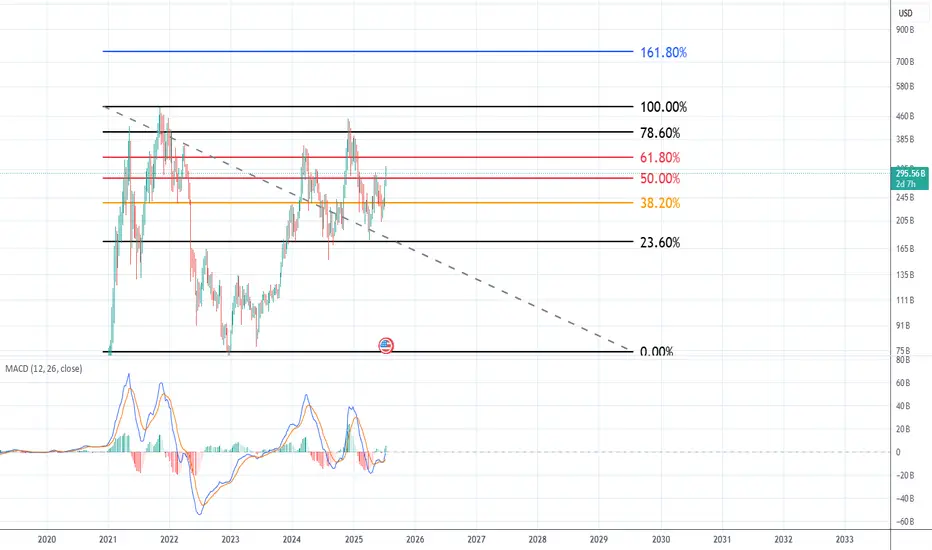
A major shift is unfolding in the OTHERS chart, it just broke above its previous high and is on track to form a golden cross, a strong technical signal that often leads to a rally.
But here's the key: a confirmed breakout needs a solid close above the 50% retracement level (from the cycle top to the latest low). That’s when things can really turn bullish.
Right now, the broader altcoin market hasn’t truly taken off. We’re still early.
This is the time to scan the charts. Look for altcoins that are showing similar strength and structure.
🔍 One standout? CRYPTOCAP:LINK is already flashing signs of what's to come.
#Altseason2025
4/ Altseason: Live -The Final game is in September. My plan Altszn Live #4: My <50% Win Rate, the Psychology of Missed Profits, and the Endgame in September. Start with 10k
Let's be brutally honest. Running a public trading experiment comes with immense psychological pressure. This isn't a game. It's real money, real nerves, and a real reputation on the line. The last 9 days have been tough; I hit a losing streak, and I want to show it to you, not hide it. Because trading isn't a non-stop party of green numbers. It's a marathon where your own psychology is both your greatest enemy and your greatest ally.
Section 1: Working on Myself. My System vs. Crowd Psychology
To be profitable in the long run, you have to be honest about your strengths and weaknesses. My weakness? My trade win rate is less than 50%. Yes, more than half of my positions do not close in profit.
My strength? I've developed one rule that allows me to stay profitable despite this win rate. This isn't some pretty quote; it's a hard-won system: "Hold your profitable positions for as long as possible, and close your losing positions as quickly as possible."
Now, look at the market. Most people do the exact opposite. They "marry" their losing positions for years, while a 20-30% profit is an irresistible temptation they must lock in immediately.
This leads to the pain of missed opportunities (FOMO). I went through this myself with $RSR. I was waiting to buy at 0.081. The price touched 0.083 and then flew to 10 cents without me. That feeling of the market leaving without you while you wait for the perfect correction is familiar to everyone. It's that burnout that causes you to make mistakes. But I've learned my lesson: there will be no deep corrections this season.
Section 2: Altseason in Full Swing. Where is the Money Flowing, and Where is the "Final Station"?
Altseason is already here. This isn't a guess; it's a fact. Billions of dollars in USDT and other stablecoins are pouring into the market right now. Bitcoin is at its highs. Ethereum is moving up aggressively, just as I've said in my previous posts. But the biggest potential isn't in them right now.
Money moves in waves in the market. You need to understand this to avoid getting on at the "final station":
1. First, Tier-1: Capital flows into BTC and ETH. (This phase is almost over).
2. Then, Tier-2: The flow shifts to large-cap projects (LINK, UNI, SOL, etc.). (Happening now).
3. Next, Tier-3 & Tier-4: Money moves into smaller, riskier altcoins. (Our main target).
4. The Finale - Memecoins: Euphoria, insane percentages, media headlines. When your grandmother asks you about Dogecoin — that's the "final station." It's time to get off the ship.
And we have a date. September 2025. For me, this is the deadline, after which I'm moving into stablecoins and waiting for major shifts in the global economy.
Section 3: My Hunt for "Green Flags" and the XETR:HEI Trade
How do you find that Tier-3 project in this chaos that could deliver massive returns? I look for "green flags." The main one is a rebranding. New tokenomics, a new chart, a new concept. It's a startup with a history.
It was precisely this principle that led me to XETR:HEI (formerly AMEX:LIT ). A small capitalization, a strong narrative, and a complete reset of old holders. The probability of such a project taking off is extremely high.
I'm managing this trade, from entry to exit, in real-time within my private channel. These aren't just signals; it's a demonstration of the system in action.
Conclusion & Call to Action
This public experiment is my personal challenge. I have one shot and only two months to show a result. I'm sharing everything: the wins and the losses. All proof of my trades is available on streaming platforms.
In the first post about Altseason, I invited you to join this journey, and the response was incredible. It brought many strong and mindful people into our community. Let's continue.
If you want to follow my trades in real-time, and ride this final wave of the altseason with me, write "Altseason " in the comments or in pm
And I have a question for you. Share your thoughts, your pain points, your projects. What's on your radar? And one more thing: would you want me to open a separate public account with $1000 and trade it in parallel for transparency? Let's discuss. I'm open to any suggestions.
Best regards EXCAVO
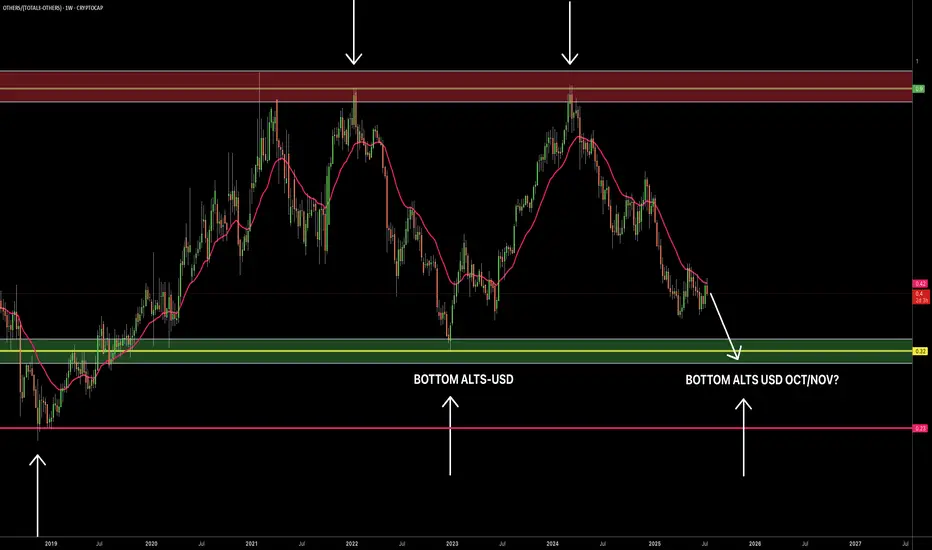
CRYPTO ALT SEASON One blue box, two different stories:
Above - Bull season
Below - Bear season
Not a financial advice

ALTcoin Market Outlook — Pivot Around Sept 15–22?This chart presents a detailed Ichimoku-based forecast for the altcoin market (Crypto Total Market Cap excluding top 10). Several technical and cyclical factors converge to suggest that mid-to-late September 2025 could mark a significant pivot high — potentially launching a strong move for alts.
🔹 Key Technical Observations:
Price rejected from the cloud and currently pulling back after an overextended move.
Tenkan (conversion) line expected to cross the Kijun (base) line next week, which typically indicates a trend decision point.
Price may retest the baseline as support before continuing higher — a healthy bullish retest scenario.
Lagging Span broke above Span A but faced rejection from the Base Line — reinforcing the idea of a necessary retest.
Kumo Twist occurs on Sept 15–22, historically a strong pivot signal (trend reversal or acceleration).
Fibonacci confluence zones project potential upside targets aligning with Fib 1.272–1.618 zones:
Conservative: 1.272 = $552B
Aggressive: 1.618 = $654B
These align with key historical reaction levels and Ichimoku projections.
Interpretation:
We may see a short-term pullback toward the Kijun, after which a strong bullish continuation becomes likely — especially if supported by macro liquidity or BTC.D rotation. The confluence of Ichimoku time theory, wave structure, and Fibonacci extensions suggests that the next major high in ALTs could occur around September 15–22, as the Kumo Twist aligns with wave count and momentum shift.
Trade Implication:
Use dips as buying opportunities as long as the Baseline holds. Expect volatility before the September pivot window, which may mark the next explosive move.
📅 Watch these levels:
Support: 263B (0.382 Fib), 281B (Kijun)
Resistance/Target: 360B (0.618), 440B (Fib 1.0), 552B–654B (1.272–1.618 targets)
This analysis is for educational purposes only. It does not constitute financial advice. Always do your own research (DYOR) and consult with a professional before making investment decisions. Markets involve risk, and past performance does not guarantee future results.

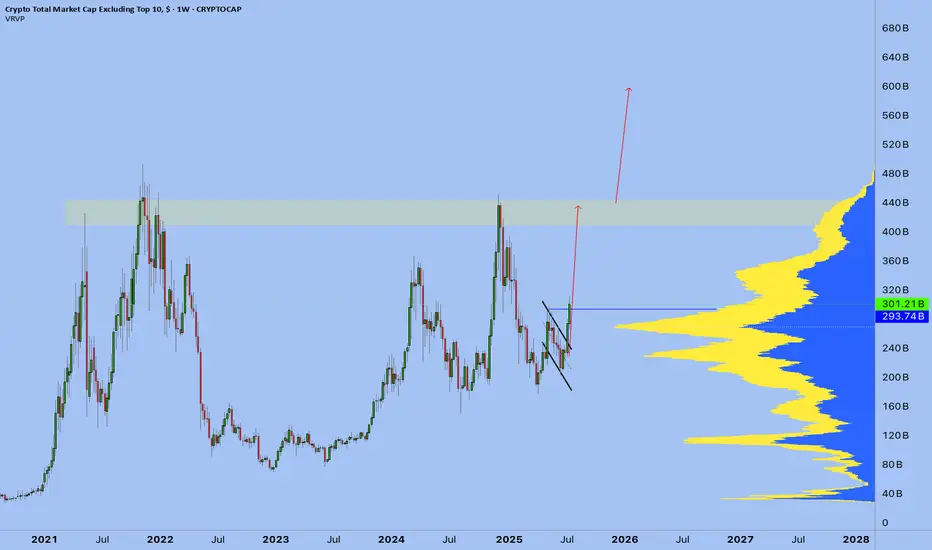
OTHERS my notes for short term230 & 260B should be strong supports. if it rises higher than 330B it'll be perfect for most of the altcoins, because it's 0,618 fib. it needs to pass that for altcoin season
not financial advices, notes for myself
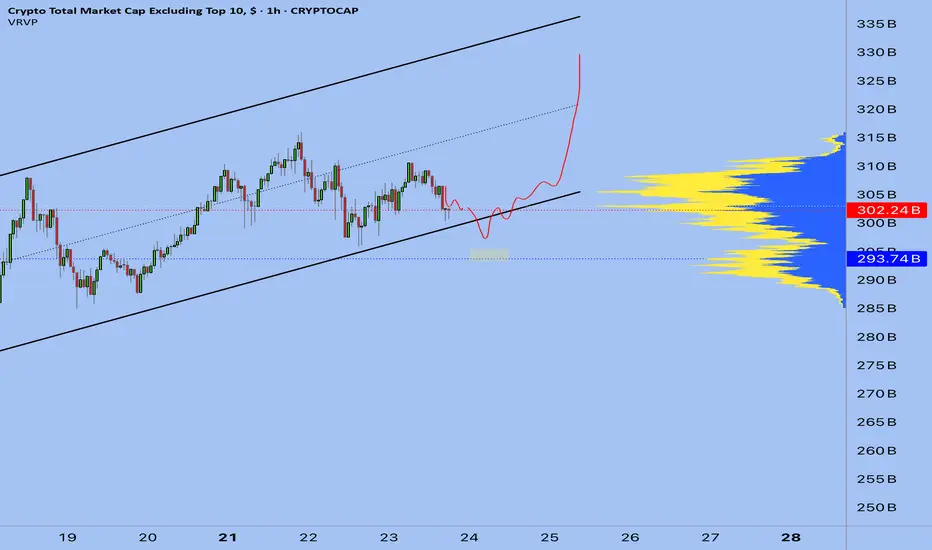
#Others Update #1 – July 23, 2025#Others Update #1 – July 23, 2025
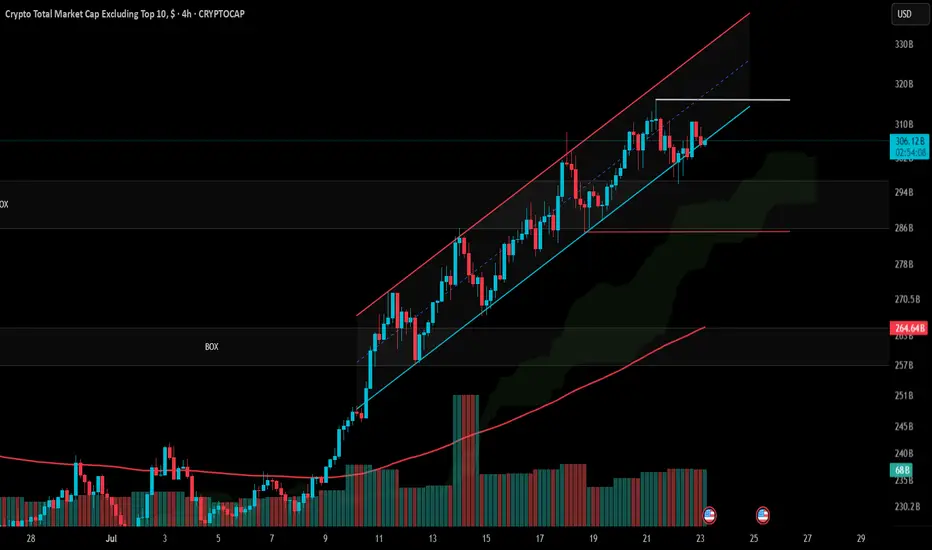
The Others chart (crypto market cap excluding top 10) had been following a well-defined ascending channel. However, in recent candles, the price has started slipping below the lower boundary of this channel — a potentially bearish sign for altcoins.
Despite still technically being within the broader impulsive structure, it’s critical for price to reclaim and hold above $316B to maintain bullish momentum.
If the market corrects back to the origin of the impulsive leg, we may see a drop toward $285B, which would likely cause a 10–20% decline in altcoins overall.
The structure is not entirely broken yet, but Others is hovering at a risky edge. If you're holding altcoins, now is the time to be extra cautious.
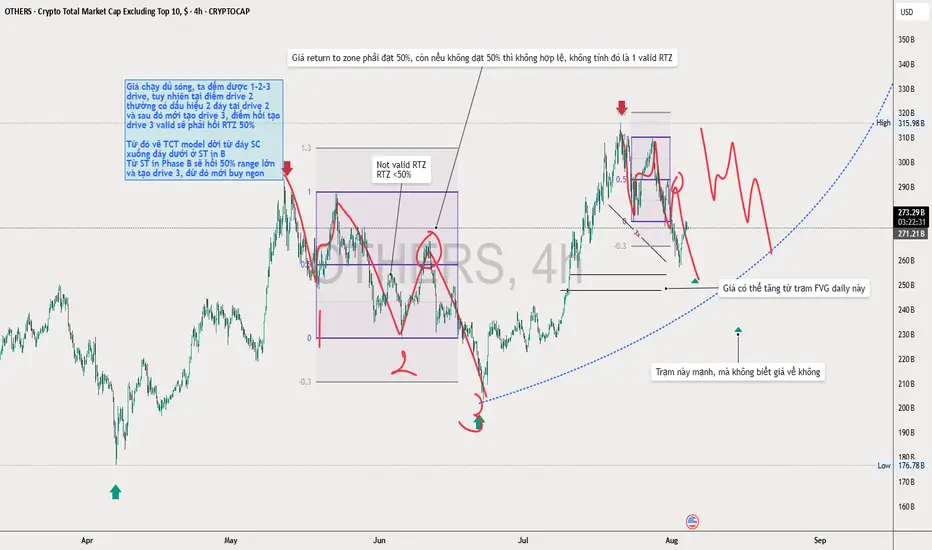
Valid Return to zone TCT modelValid Return to zone TCT model
This indicate the way to valid RTZ swing low
This is Kevin note to show the valid swing count
What to focus on is:
We find 3 drive pattern swing low and trade reversal
At swing low 2, we can see price cannot RTZ 50% and continues to the south and makes liquidity grab, then price return to 50% of the big zone. Here we can sell at drive 3 ( this is as we can see, the low volume swing of NDS, price moves fast to the downside to end the swing)
ALTSEAON CHART UPDATE OF CRYPTOCURRECIESthis is altcoins chart , braking through a bulling orderblock ,
its high prbable this gonna break ATH and the move to the new wealth making moves ,
investment is high risk and high rewarding
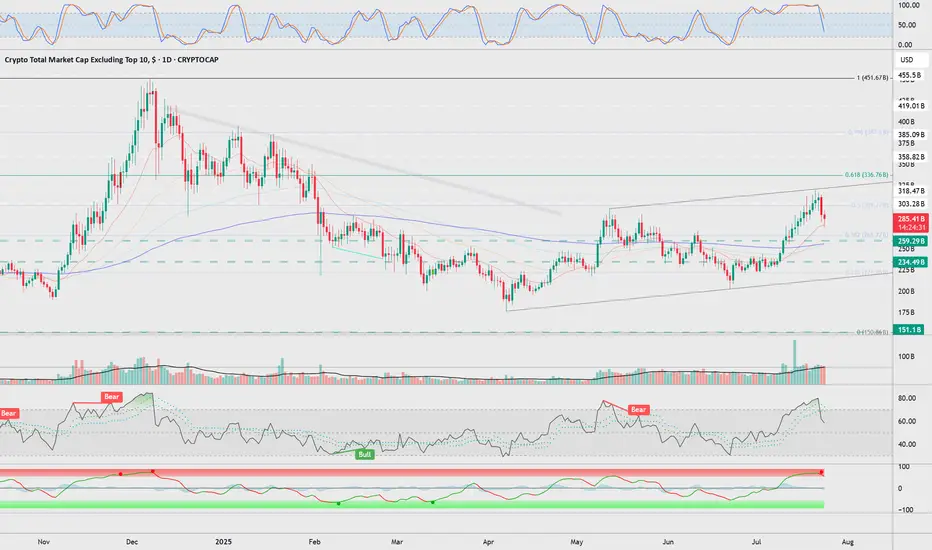
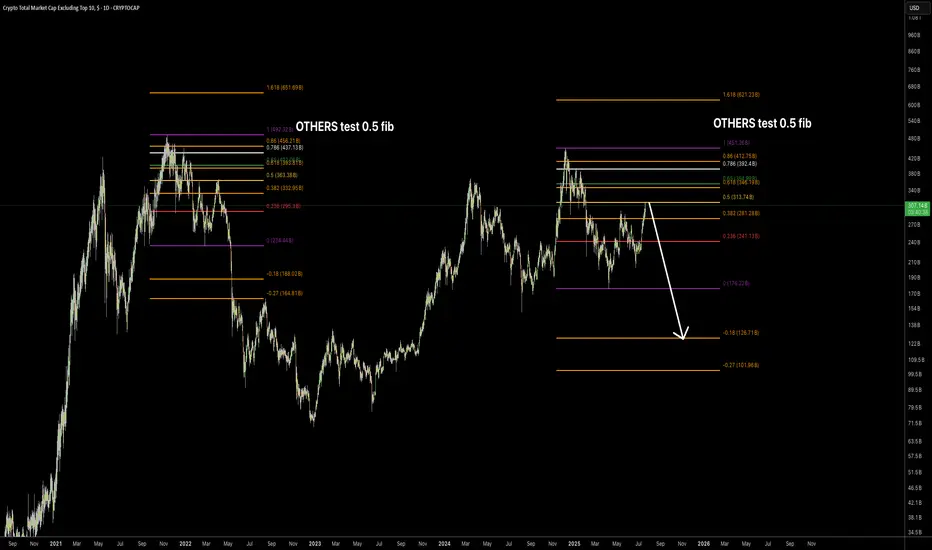
OTHERS retest 0.5 fib lvlA very important level for altcoins — this is where we need to watch closely. I believe it’s a strong resistance.
Is ETH ready to start giving up dominance to altcoins?OTHERS/ETH clearly shows where ETH dominance is likely to stall. I think altcoins will get a bounce against ETH soon, before heading into a final capitulation ahead of altseason.
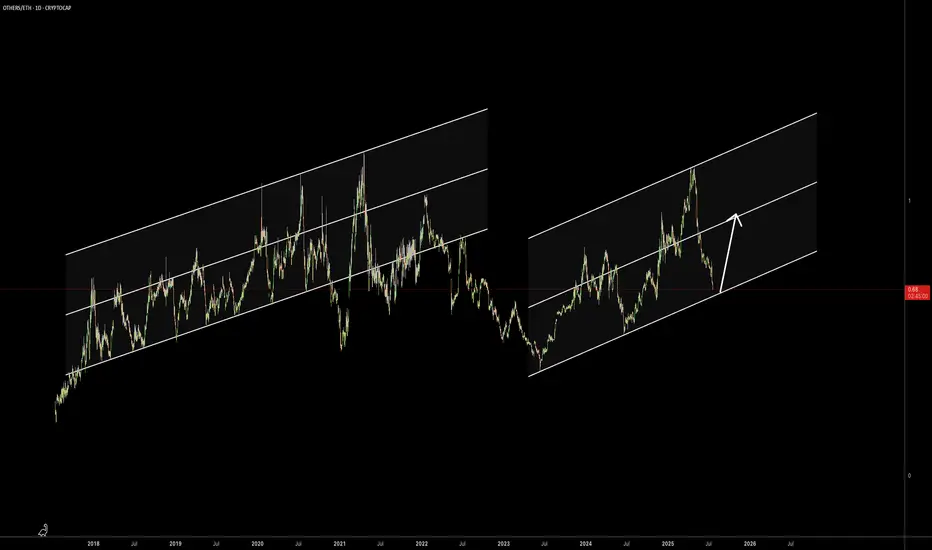
The altcoin bottom is nearHey everyone — I’d like to share some thoughts with you. I believe this chart is a pretty good bottom indicator for altcoins. It has performed well so far, and it’s what I’ll be watching when looking to buy.
OTHERS: Crossing the 618 extension from 2021 Fractal I believe the move may just be getting started. Targeting somewhere in the 1-5T range for OTHERS mcap.
/3.5 The Winner's Psychology & The Hunt for Trade
Introduction: The Dangerous Time of Euphoria
I want to start by thanking you for the phenomenal support for the "Altseason: Live" experiment. We closed Round 1 with a +92% profit on the initial capital from just two trades.
But I need to be brutally honest with you: the most dangerous time is just beginning. Let's be clear: for these two months, I won't be chasing a conservative 3% per month. I will be trading quite aggressively.
That's why, in the coming weeks, you will see various coins "pump" without any logic. Your inner FOMO will be screaming at you: the feeling that you're late, you're in the wrong coin, you've missed out. In this frenzy, many will jump on a moving train. And my forecast remains: sometime around July 17th to 21st, the market will brutally shake out these passengers.
My Philosophy: The Battle with the Main Enemy—My Own Euphoria
After a huge win like +92% on the portfolio, it's very easy to get caught up in the "winner's high." A dangerous confidence appears, the feeling that you've figured out the market and that it will always be like this. This is a trap.
That is why I did something that might seem illogical: I cut my position size for the next trades by a factor of four.
Why? To tame that euphoria. To prove to myself that discipline is more important than elation. To remember that my win rate is not 100%, and a single losing trade on a wave of overconfidence can wipe out all the previous hard work. The most important thing is my inner calm.
Of course, when I talk about "calmness" in the context of futures, leverage, and altcoins, it sounds ridiculous. I get that. But striving for inner composure is the only shield a trader has.
My core principle remains unchanged: Fear losing more than you fear missing out on gains.
The Hunt for Leaders: My Methodology for Picking the Next Trade
Rebranding and New Tokenomics:
When a project undergoes a rebrand, it almost always means the team has a plan. The pressure from old sellers decreases, and the probability of a subsequent rally is high.
' Smart Money' Footprints (Accumulation):
This is my favorite pattern. Long periods of accumulation at certain levels, anomalous volumes, and candles with long wicks—all of this indicates that a major player has entered a position and is preparing for a breakout.
New Listings and Unique Patterns:
Projects recently listed on top exchanges don't have the "baggage" of disappointed holders. Over the years, I've noticed certain unique patterns in their charts that have a high probability of leading to growth.
The Art of the Entry: Hunting for the Entry Point
I try to enter positions with limit orders, and I always wait for a pullback. I look for an entry on a local correction when panic is shaking out the random passengers.
Hunt for your entry point. That is the most important thing.
The Golden Rule: Not a Single Step Without a Stop-Loss
Trading without a stop-loss is suicide. Accepting a small, planned loss is not a weakness but a part of the professional game.
What's Next?
I've already missed one coin I wanted to trade—it took off without me. I didn't chase it. Now, I am patiently waiting and searching for the next setup that meets ALL of my criteria.
The "Altseason: Live" experiment continues. You can watch everything in real-time on my streams. The hunt is on.
Thank you for your attention.
Best Regards EXCAVO
3/ Altseason: Live - My System: Cut Losses, Let Profits RunIntroduction: The Whole Truth About Trading
The "Altseason: Live" experiment is in full swing. Before we continue, I want to show you something important. Not just the wins, but the complete picture.
This is real trading. With big wins and unavoidable losses. And this single screenshot contains my entire philosophy.
My Core Strategy: Cut Your Losses, Let Your Profits Run
My main job as a trader comes down to two simple rules:
Hold my winning positions for as long as possible.
Cut my losing positions as quickly as possible.
Look at the screenshot again. The losing trades on SAGA (-90) and PUMP(−595) were closed fast.
The moment I realized the setup wasn't working, I got out. No hope, no emotions. This is the cost of doing business.
Now, look at MAV (+4,302) and RONIN(+3,254)
I let them run because they were following the plan. These two trades brought in +$7,556 in profit, more than covering all the small losses and securing a great overall result. This is how the system works.
The Winner's Psychology: The Battle with Euphoria
After a series like this, it's easy to get a "winner's high" and believe you're invincible. That's a trap. That's why, after the first wins, I deliberately cut my position size for the next trades by four times. To tame that euphoria and remember that discipline is more important than overconfidence.
My main principle remains : Fear losing more than you fear missing out.
The Hunt Continues: The Current Position
This system isn't a theory from the past. It's working right now. As of this moment, I have one open position in :
GETTEX:WOO , which is already showing over 2121 in unrealized profit.
I plan to manage this trade by the same rules and will likely close it within the next 1-3 days.
What's Next?
I'm not looking for dozens of trades. I'm looking for a few high-quality setups where I can apply my system. I use limit orders to enter on pullbacks, and I always use a stop-loss.
The experiment continues. You can follow it all in real-time on my streams, where I broadcast my trading terminal.
Thank you for your attention. The hunt for Trade #3 has already begun.
Best regards EXCAVO
2/ Altseason: Live - My Coin-Picking StrategyThe "Altseason: Live" experiment has unofficially begun. While many are debating if altseason will happen at all, I prefer to act. We may not see a classic, market-wide surge across all coins. The market has changed. But I believe that targeted, explosive opportunities always exist.
In this post, I won't be giving signals. I will share something much more valuable- my methodology for selecting coins for this final push. This is the exact approach I'm using right now.
Principle #1: Finding the 'Right' Cycle
I've long observed how major players profit from altcoin cycles. In every asset that shows exponential growth, I almost always see three distinct phases: Pre-Pump, Pump, and Super-Pump.
This isn't chaotic growth; it's a managed process. We've seen numerous examples over the past year. Let's look at the RSR chart as a textbook example of such a cycle.
My task is to find coins that have completed their accumulation phase and are now in the "Pre-Pump" stage.
Principle #2: Detecting the 'Footprints' of a Major Player
How can you tell if a major player is in a coin and ready to make a move? I look for what I call "candles with long wicks."
When you see an abnormally long lower wick on a chart with increased volume, it often means one thing: someone is trying to buy a large amount, but there isn't enough liquidity in the order book. The price drops, they sweep up everything available, and the price snaps back up.
For me, this is a clear sign—there's a "whale" here. They are defending their level and continuing to build a position to distribute at much higher prices.
Principle #3: Risk Management and the First Trades
Based on these two principles, I've gone through my extensive watchlist and selected my first targets. My choice fell on MAV and RONIN. On their charts, I saw the exact patterns I was looking for.
I want to be perfectly honest: this is aggressive trading. To achieve my ambitious goal, I will be taking risks. But I am only risking an amount that I am mentally prepared to lose. You have to understand: this is the crypto market, these are altcoins, often with low liquidity, and this is all happening on centralized exchanges. The risks are maximal.
What's Next?
The goal is set. The first steps have been taken. I will try to act carefully but decisively.
I'm documenting every step of this experiment. You'll be able to see everything with your own eyes, including my real PnL and open positions, on my regular livestreams.
Thank you for your attention. Fasten your seatbelts; we're taking off.
Best regards EXCAVO

ALTS Season is coming Hello, I hope you are all well
Today I'm going to share this idea with you. This chart shows the liquidity of altcoins below the top 10
I expect to see an upward trend from these areas and targets, as depicted in the chart.
Don't forget to manage your risk. This is not investment advice. Altcoins are highly risky, and you could lose all your money
Good luck to everyone 🤍

1/ Altseason: Live - My Game Plan for the 2 Hottest Months
Many of you will remember my forecasts over the past year: first, I said we had a year left, then six months. Now, looking at the market, I can say with confidence, we have about two months left until the end of this bull cycle.
Bitcoin is hitting new all-time highs, while most altcoins are just starting to lift off the bottom. Today, I want to break down exactly why I believe this period isn't just the end of the cycle, but the most concentrated period of risk and opportunity in our entire careers.
In this post, I will share my vision of what's about to happen and how I'm personally preparing for this final act.
The FOMO Phase: The Psychology of the Final Push
Everyone understands that something is happening in crypto right now. But most have already "missed the train" on Bitcoin. They either failed to buy in or sold too early. What's next?
- The Fear of Missing Out (FOMO) is reaching its peak. Those who sold at $70k now see that the price could fly to $100k. Buying into Bitcoin now feels too late and too risky.
- A chaotic search for projects that haven't "popped" yet. The crowd's attention shifts to altcoins that haven't shown explosive growth.
- Liquidity starts to jump around feverishly. Every day, we see random projects pump 30-40%. A game of "guess who's next" begins, and the market turns into an orchestra without a conductor.
The Technical Picture: Cycles Don't Lie
This isn't my first, second, or even third altseason. And experience shows that what is happening now is logical.
BTC Dominance: We are seeing capital begin to flow from Bitcoin into altcoins. First into the large-caps (ETH, SOL), then into the mid-caps, and finally, into the small-cap projects. The BTC.D and ALT/BTC pair charts confirm this every cycle.
The Timeline: My cycle analysis points to September as the final destination. This gives us approximately two months for the main event.
New Factors: Of course, this cycle is different. Bitcoin and Ethereum ETFs, the arrival of giants like BlackRock, and the RWA narrative all add new dynamics. BlackRock is already heavily invested in Ethereum, and they will start to defend and pump their asset, and I believe they will do so regardless of the classic cycle theories.
The Double-Edged Sword: The Greatest Opportunity and a Deadly Trap
It is precisely in this short period of desperation and greed that the biggest gains are made.
The Opportunity: Assets can fly by hundreds of percent in a matter of weeks. This is the moment that all crypto traders dream of.
The Trap: It is also during this period that 95% of participants will lose money. Why? They have no plan. They will buy at the peak of euphoria and sell at the bottom in a panic, getting stuck in their positions for years. I still receive messages from people who bought Solana or ETH at the last cycle's peaks.
My personal principle is this: it's better to leave some profit on the table than to give in to emotion and lose everything. I will be strictly adhering to my timeline, regardless of market euphoria.
My Answer: Live Trading
To simply watch from the sidelines this time is a crime against your own capital. To act without a clear plan is financial suicide.
That's why I've decided to go a step further. I'm launching "Altseason: Live"- a public experiment where I will show, with real money, how to manage risk and seize this unique opportunity.
This will be more than just analysis. This will be real-time trading, and I plan to show key moments and trades live on stream.
I will reveal all the details, including the streaming platform and the terms for participation, in the coming week.
The next few weeks will determine who emerges from this cycle as a winner. Make sure you are following and have notifications turned on, so you don't miss the main announcement.
The question is, what balance should I start the experiment with? 100/1000/2000/10000$
Best regards EXCAVO

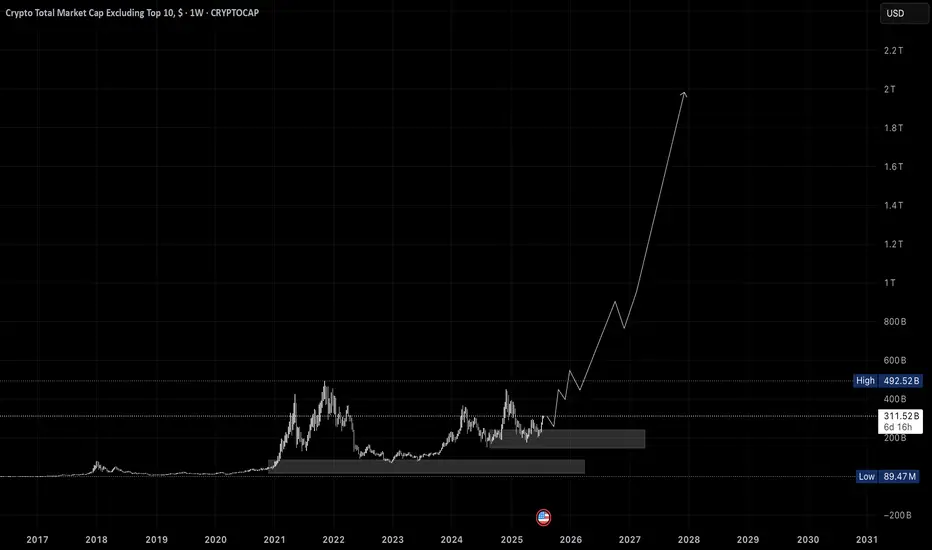
Altcoins Market Cap: We on the Verge of a 5T Exposion!Hey crypto traders! Let’s dive into this monthly chart of the Altcoins Market Cap. You won’t believe what’s brewing!
We’re currently approaching a critical channel support at 200B, a level that might act as a springboard for massive rally — check out the jumps from channel support in 2019 and 2023! Each time the market cap hit this support, it skyrocketed, and now we’re at that pivotal moment again.
The chart projects a jaw-dropping target of $5T within the next 24 months if history repeats itself!
The price action shows we’re testing the lower boundary of this ascending channel, with the market cap sitting around 239.65B. A bounce here could send altcoins on a parabolic run, potentially hitting 5T by mid-2026. But if support fails, we might see a dip toward 100B — let’s keep an eye out!
Key Levels to Watch:
Support: 175B (channel support)
Resistance: 1.55T, 5T (projected target)
Breakdown Risk: 100B
Are altcoins about to explode to 5T, or will we see a deeper correction? Drop your thoughts below!
PS take a look at others vs. btc price action here:

$OTHERS: Decision Time for AltcoinsDecision Time for Altcoins
Unless something drastic changes — like Trump firing Powell and cutting rates to 0% — the chart suggests a potential correction.
MACD is overheated, RSI is overbought, and we're hitting major resistance. An ABCD or extended ABCDEF pattern seems likely, with a upside target around $260B amd a downside support at $230B in total altcoin market cap.
Of course, the market can always choose to ignore the signals and continue its uptrend directly to the next resistance at $260B.
Stay sharp. Let’s see how it unfolds.
DYOR.
#Altcoins #Crypto #Bitcoin #ETH #MACD #RSI #TechnicalAnalysis #CryptoMarket #DYOR #PriceAction
