The Altcoin Bloodbath Is Over — New Highs Ahead!Altcoins have likely found a bottom, with CRYPTOCAP:OTHERS rebounding off its channel support, aligning with the 78.6% Fibonacci retracement level. This confluence suggests a strong technical base, positioning the market for a move toward new highs at the channel top. If momentum follows through, altcoins could see a sustained recovery as liquidity returns to risk assets. 🚀
OTHERS trade ideas
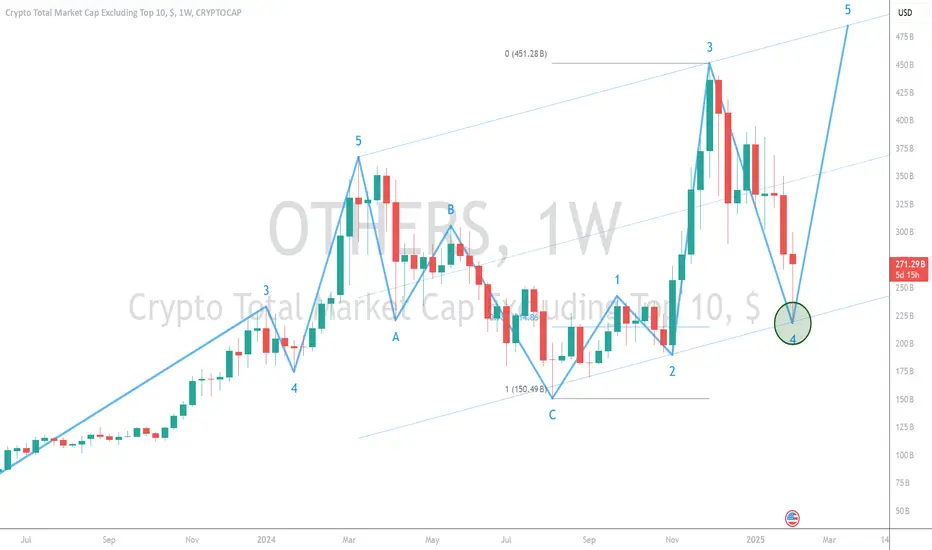

Altcoin it's so over ?Alt (OTHERS) peaked at 450B and this price successfully create 5th waves of Elliot Wave
So this scenario is posible if we will rugged in Altcoin if we break 299B

ALTSEASONThe reflection is every 4 years, specifically February, and the ascent continues for a year.

OTHERS Crypto Market Cap Candle Color Close Monthly ALT SEASON ?OTHERS crypto Market Cap Monthly candle colour close since 2014
OTHERS Crpyto Market Cap - Top 125 coins Minus top 10 by Market Dominance.
OR, Mid Cap ALTS
February stands out MIGHTILY in the otherwise very closely matched Months in the OTHERS ALT Market
February is unique in the Lower Cap ALTS with a 4x higher chance of a GREEN candle close
January 2025 closed RED as opposed tot he Bitcoin January GREEN close.
Previous 4 Red Jan were followed by a Green Feb
3 of those were followed by a Green March also
ALTS should do well
ALT Season ?
To some extent, this is confirmed by the Bitcoina nd TOTAL Charts I have just posted prior to this one.
However, It really needs to be understood that this information is purely based on previous market moves· The MNArket is changing right now and we have NO guarantees that this will plat out.
However, it does look like we ar ein with a chance of an ALT seasom opver the next few Weeks but this does rely heavily on Bitcoin letting go of its dominace.
The question is, will it ?
We can only wait and find out

OTHERS/BTCUSD Technical AnalysisReady for that juicy altcoin season? Let’s ride this wave all the way to the moon! Or maybe I'm wrong and we're all cooked.

Prediction - Others (Altcoins)Price is confirming the longer trendline from last top. I believe this will make a breakout now.
I think this will trigger the larger bull run in Altcoins.

ALTcoins Have Still Space For More GainsHello Crypto traders!
Crypto market remains nicely bullish as expected and if we take a look at OTHERS Crypto market cap chart, which excludes top 10 cryptocurrencies, it's looking for a bullish break into a 5th wave out of wave (4) bullish triangle pattern that can send the price into all-time highs and 500B area. Bullish confirmation is above upper triangle line and 400B area.
So, with current risk-on sentiment and while stocks have space for more upside, still watch out for more gains in the Crypto market once current consolidation fully unfolds, especially if we consider USDollar weakness.

UPDATE: Altcoin Market Set to Surge Toward $1 Trillion Should this pattern hold, we could see the altcoin market targeting full Fibonacci extensions, potentially ripping to all-time highs and pushing the market toward a $1 trillion valuation this cycle.
Momentum is building as liquidity returns to the crypto markets, with growing retail interest and institutional capital eyeing opportunities in diverse altcoin sectors. Rotation out BTC is happening as the BTC rally is losing momentum.

Altcoin Market Set to Surge Toward $1 TrillionThe altcoin market is eyeing a significant breakout, currently consolidating between the 0.618 and 0.786 Fibonacci retracement levels. Historically, a decisive move through this zone often precedes explosive rallies. Should this pattern hold, we could see the altcoin market targeting full Fibonacci extensions, potentially ripping to all-time highs and pushing the market toward a $1 trillion valuation this cycle.
Momentum is building as liquidity returns to the crypto markets, with growing retail interest and institutional capital eyeing opportunities in diverse altcoin sectors. If sentiment and technical alignments continue, the path to unprecedented valuations may be closer than we think.

Altcoins about to capitulate- this bull market cycle has been extremely difficult to navigate in the sense that altcoins are most of the time trading like crap with sporadic bursts to the upside
- most of that can be attributed to eth/btc being in a macro downtrend
- the chart of OTHERS is in a clear distribution formation and pending a daily close below the neckline the descending triangle likely gets confirmed
- more downside likely

Unpopuper Altcoin Index PatternOTHERS/USDT Dominance, this is insane we created a symetrical triangle from early December till now
if this breakout we will see bullish continuation ahead as dominance trader in stable coin decrease and move to altcoin

OTHERSEW Triangle held the price from E at the line with a nice bounce. To confirm further, we need to break out of the triangle.


Altseason part 2 is starting - Stop the drama and focus ! CRYPTOCAP:BTC.D CRYPTOCAP:TOTAL BINANCE:BTCUSD BINANCE:ETHUSD
Despite ALL the recent negativity due to the market's decline, the crypto market remains bullish 🚀.
We witnessed the first part of the altseason in November, with significant gains on many coins.
Now, it is normal to see a correction before the second phase of the altseason begins.
❓ Why is this correction happening
This correction is a natural part of the altseason period. It allows:
- Existing investors to take profits 💰.
- New investors to enter the market at more attractive prices 🤑.
So, stop the drama! And focus on preparing your wallets for the next phase 🔥.

OTHERSThe last chart I posted of OTHERS shows "E" of the Elliot Wave triangle where the price is currently. Let's see if we can bounce from here.

Alctoins: Get Ready for TakeoffHere's the deal:
Altcoins are heating up: Bitcoin's taking a breather, and that means it's altcoin season! The chart shows we're forming higher lows, and people are buzzing about it online.
Breakout on the horizon? We're facing some resistance, but if we break through, things could get really exciting.
What to watch for:
Listen to the crowd: When everyone's shouting "to the moon!", "alctoin season" you know something's up and deleverage.
Don't get greedy: Remember, the market can turn on a dime. Stay smart and manage your risk.
Bottom line: This altcoin chart is looking juicy.
Comment your predictions

Alt Season Finally About to Begin
It has been a pretty brutal stretch for the majority of alts since this chart topped in the first week of December. However, after almost 2 months of accumulation we are seeing more and more compression on this chart ( notice the higher lows and lower highs).
Once this pattern breaks, which I believe it will sometime in the next 7-10 days (based on the current rate of compression), alts will start ripping to the upside.
I think the market makers knew how bullish the majority of retail sentiment was at the beginning of this month (new year, new administration) and wanted to delay the true breakout until sentiment was more bearish.
I will post my elliot wave analysis for the bigger picture on this chart once we get a breakout to the upside. I think this wave will be explosive and we will start to see daily candles with >50% on many different alts.
Bottom line, if you own alts, this should be the chart you are focused on. And its almost ready.

OTHERSIt may be challenging to read, but it seems we are missing one more leg down to E. First indication for braking to the upsude will be braking of the RSI.

24R Other LongTrade idea for the altcoin market index.
If the market comes down to the buy zone by Friday or Monday next week then I see this as a valid opportunity to go long.
High risk opportunity, but I think the chances are reasonable and would rate this 30% likely.

ALTCOINS This parabolic curve is about to initiate the AltseasonEach Bull Cycle has its own parabolic trend that guides the trend to the new peak.
In 2019-2021 that only broke during COVID (obviously) and then June 2021. It held throughout the majority of the Bull Cycle and gave the fairest exit possible.
Right now, the altcoin market is closing in on the current parabolic curve.
We are a few weeks tops before the next bullish wave on this curve, which will be this Cycle's Altseason.
The time to invest in alts is running out..
Follow us, like the idea and leave a comment below!!

Altcoin SeasonI'm looking for Altcoin - top 10 to breakout after breaking $375B. That is the key level to look at if we're wondering when Altcoin Season kicks in...

Trump Has Promised Life Changing Gains MartyBoots here , I have been trading for 17 years and sharing my thoughts on OTHERS here.
Its looking beautiful , very strong chart and ready to have an ALT Season beakout
Do not miss out on making life changing gains
Watch video for more details
