OXT patternOXT will repeat the pattern. The drawn arrow is for the most bearish scenario with maximum profit from that bounce. Might even do it earlier.
OXTBTC trade ideas


You can do it OXT...! :)Just an idea, do your own Research...! :)
we may Pass 1218 sometime soon, then we can make it to 1391 in no time...(0.618 Fib resistance)
SL-1178
Cheers!

OXT/BTC Long Breakout (H4)Trades > Create:
(Current Price: 0.00001190)
Either confirm or choose to edit the trade
⚡⚡ #OXT/BTC ⚡⚡
Client: Binance 01
Trade Type: Breakout (Long)
Entry Targets:
1) 0.00001221 - 100.0%
Take-Profit Targets:
1) 0.00001309 - 51.612%
2) 0.00001385 - 25.806%
3) 0.00001507 - 12.903%
4) 0.00001705 - 6.451%
5) 0.00001828 - 3.225%
Stop Targets:
1) 0.00001036 - 100.0%
Trailing Configuration:
Entry: Percentage (0.0%)
Take-Profit: Percentage (0.0%)
Stop: Moving Target -
Trigger: Target (2)


OXTYOUR LIKE OR COMMENT IS MY FUEL FOR NEXT ANALYSIS :)
This is not a financial advice. Always do your own research and always put stoploss in your trade (SL) :) If you want more detailed info how to study and read charts or just need help with some coin, just write to me here a comment, i will try to answer to everybody... i can help you :) all for free, don't worry, BE HAPPY!
If u like the analysis, please feel free to ask any question about this TA or crypto or any coin - leave a comment or like or share the idea, i really appreciate it because then my work makes sense :) thanks!

OXT/BTC OXT is respecting its trend line support every time it reaches there , this is creating bullish scenario for a heavy pump , a healthy retest of trend line is a buy.


Orchid (OXTBTC) Can Go Straight Up Above EMA100 w/ TargetsRight now OXTBTC, Orchid, is trading above EMA100 on the daily timeframe.
EMA100 is the blue line on the chart.
This is a strong resistance level that is now being challenged.
If OXTBTC closes above 0.00001247 (EMA100) today, we can expect higher prices as marked by the green arrows.
EMA50/10 (light blue area on the chart) works as support.
This is a strongly bullish chart setup.
The targets are marked on the chart.
Namaste.


Orchid (OXT) / BTC - Bullish dvergenceA 90% correction since mid-August (like so many other alt coins) and following oversold condition (orange column); an ‘incredible buy’ opportunity now exists.
On the above 1-day chart a regular bullish divergence can be observed between price action and the money flow index (MFI). Price action now finds support on the 21-day moving average.
The 3-day chart provides a clearer picture with a bullish engulfing candle on price action.
Lastly on the weekly dollar chart a Dragonfly DOJI candle was printed. Normally we expect to see these as a trend reversal following a sell off. However as Stochastic RSI is crossing up in 80 it is a strong indication of further upside momentum.

OXT/BTC Ready to explode?
Once it breaks 0.00000966 sats,( 50daily MA and 05fib resistance) it should start curving parabolic
Make sure to take profit on the way fast because things can turn really ugly with this one. :)
high rise high reward don't go all-in on it .
Buy it but it below 0.00000910 sat.
for this call to be valid 0.00000787 sat must not break. otherwise exit.
Target are on the chart.

OXT/BTC - 4hr Golden Cross - Where Next?The question for me is the degree to which it goes parabolic now that the 4-hr Golden Cross has officially occurred and been sustained for a few periods. Here are some options.

OXT/BTC Trend Holding for Golden CrossLooks like this one is about to pop....already had crosses on the 2 and 3-hr timeframes, but this 4-hr one should be big. Increasing bull volume to support the thesis too .


$OXT BOTTOMING??Still in a downtrend like many altcoins compared to Bitcoin, but this one on 4H timeframe seems like having doble bottom and rsi trending higher.. a 15% pump here can do wonders on usdt pair


OXT - BTC My AnalysisI am looking bullish on OXT / BTC I am trying to buy between 0.00001330 - 0.00001380 BTC
Stop Loss: 0.00001100
Sell target 1: 0.00001600
Sell target 2: 0.00001800
Guys don't forget to Click Like button for appreciate me.
Thank you so much.

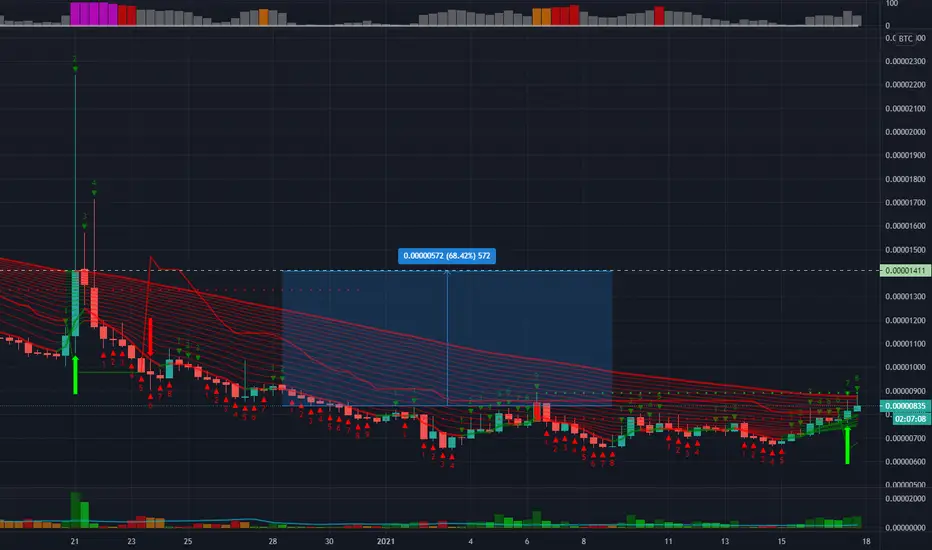
OXTBTC Prints Reversal CandleOXTBTC just printed a strong reversal candle if we go by "candlestick reading".
Notice the strong candle yesterday, November 18.
This candle is really high volume to close above EMA10 and we have a higher low compared to the candle that was printed a few days before.
When we put these two together, the chances are high that after consolidation, we get to see a price jump.
Conditions for change
If prices for OXTBTC break and close below the red dashed-line (green space), this chart analysis is invalidated.
Trading above this level = bullish. (Green arrows)
Trading below = bearish. (Red arrows)
Namaste.

OXT ORCHID Ready for 50 to 100% Jump - OXTBTC OXTUSD OXTUSDT OXT ORCHID Ready for 50 to 100% Jump - OXTBTC OXTUSD OXTUSDT
