This Pattern Could Cause OXT To PUMPOverview
- Long-term OXT remains bullish as March has already been a great month for this project. Let's start from the top!
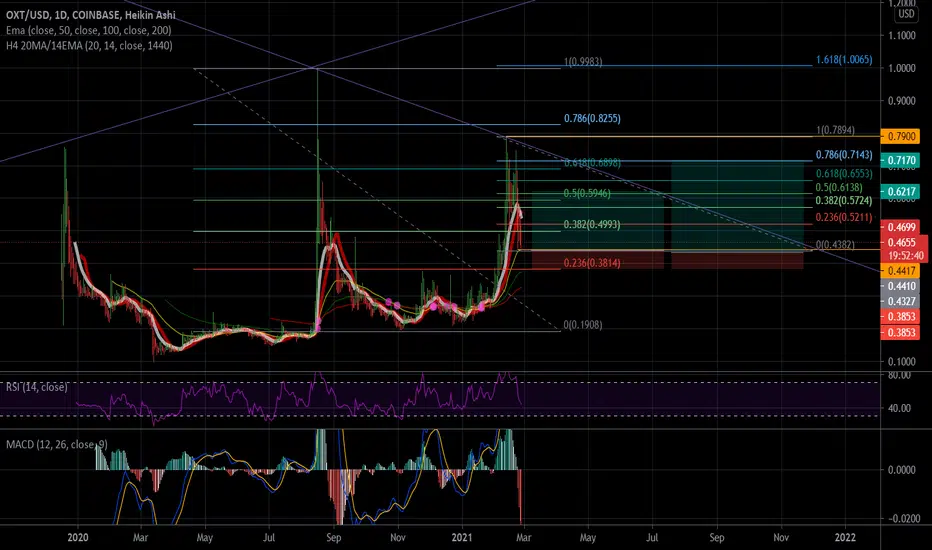
Price Chart
- Daily Chart for OXT with 20/50/200 MA's shown to help indicate future supports
- Still possible for OXT to be making a large inverse head-and-shoulders (Shown on chart, yellow)
- Could be testing the 20/50 MA's if BTC sees a pullback from its recent run
- Bullish as long as we stay in the triangle
RSI
- RSI is still healthy and would like to see it above the green dotted line soon. Why? Could be the resistance of a triangle in the RSI and if broken, could cause a breakout
Stoch
- Stoch value is high so not the best place you would like to put an entry unless other indicators are telling otherwise. Could see short-term selling before going higher
4-Hour Chart
1-Hour Chart
- I'm a big fan of the red trendline in the RSI, great entries to longs or swing trades. Dotted green marks potential sell if hit
Additional Info
- Learn about OXT here: www.orchid.com
- OXT Volume: coinmarketcap.com
- Expand your trading knowledge by understanding the Inverse Head & Shoulders pattern here: www.investopedia.com
If you enjoyed this analysis or learned something new, please LIKE this idea so more people can be aware of the possibilities of this coin.👍
Feel free to FOLLOW for for important updates for this coin and trading strategies.🏆
Would also like to know your thoughts! Remember this is not financial advice , however, it is an overview of what I am seeing in this coin's price action.
-Happy Trading
MoneyGrind
OXTUSD trade ideas

OXT Short TermOXT is a cup and handle machine, 1yr, 1 week, and now daily all leading up to a big explosion. Guessing it'll break first resistance and hit the longer term resistance with a 38% fib retracement which would form another short term cup and handle before fully going to the moon. PRIV8 conference with Edward Snowden in less than 10 days plus stimulus checks coming out as we speak. Should be a big move 🚀👨🚀👩🚀
-Strong RSI
-Positive MACD on daily and about to flip the 4HR
-Bollinger Bands about to burst on the daily chart🔥
Minimum $1.20 for my reserved guess by April, but have a feeling it could be much more. 🤷♂️
NOT FINANCIAL ADVICE


OXT USD CUP AND HANDLEOne rarely sees a cup and handle of such quality.
There are multiple factors suggesting further upside.
1) The reversal pattern
2) Macd turning green on the daily
3) Growing RSI
4) Volume breakout
5) Forming an inverse head and shoulders against btc (not shown in this chart)
If btc continues the positive trend, 2$ would be possible.
Just an idea as usual, do your own research.

OXT Orchid about to rip higherOXT Orchid about to rip higher
I have been buying the dip on this one as they are extreme.
I have been touting OXT since September see referenced chart.
I mean look at the Profiles of the management, I would love to have a guy from Ethereum core and the guy who made Jail brake for iPhone.
Add a dash of privacy VPN portal to project concept and you have a hot topic on your hands.
Not Financial advice.
This is just my trading journal.

HUGE Volume Coming Into OXTOverview
- Just had HUGE volume coming in! This keeps up the argument for a $1 will be even stronger. Let's start from the top!
Price Chart
- 4hr chart with price just recently breaking through the macro triangle's resistance line
- If price closes above the previous macro triangle resistance line, could see $0.74 soon
- Made a dotted green trendline on the highs. Break through this $1 will start becoming more realistic
- If we consolidated in this area for awhile may not be the bad thing.
- It's also possible we could be making a huge inverse head-and-shoulders pattern with the neckline around $0.74. If this plays out this could help OXT reach $1
RSI
- Wonderful bullish W that played out perfectly. Broke through the "Very Bullish" dotted green line so could be could possibly bounce to the upside to hit the solid green line
- Also possible we could be starting to show a declining RSI trend which could lead to temporarily lower prices
MACD
- MACD shows a strong positive green candle backed up with a now $122 million volume
- OXT Volume: coinmarketcap.com
Daily Chart
- Check out the text boxes for chart info!
If you enjoyed this analysis or learned something new, please LIKE this idea so more people can be aware of the possibilities of this coin.👍
Feel free to FOLLOW for for important updates for this coin and trading strategies.🏆
Would also like to know your thoughts! Remember this is not financial advice , however, it is an overview of what I am seeing in this coin's price action.
-Happy Trading
MoneyGrind

OXT Showing It's Quick Recovery SkillsOverview
- Overall BTC punched OXT around a bit but OXT was able to bounce back up. Let's start from the top!
Price Chart
- 1hr chart with price price currently inside a triangle. Price movement could be coming soon
- All MA's are starting to show upward movement which is great to see in case we need one to act as a support
RSI
- I sometimes use the RSI to have a better idea when to enter a trade especially when the RSI bounces off the previous low like this RSI scenario
- Would like to see upward movement, however, it's possible that we could touch the line again and break to the downside
MACD
- MACD is starting to show positive momentum could be coming soon. If the blue line can't get above the red then could see further selling short-term
Daily Chart
- Daily chart looks amazing
- Potential to show long-term positive momentum(PM) (green line= predicted PM top if BTC remains bullish)
- Break above dotted RSI and you'll get real bullish then
Additional Info
- Learn about OXT here: www.orchid.com
- OXT Volume: coinmarketcap.com
If you enjoyed this analysis or learned something new, please LIKE this idea so more people can be aware of the possibilities of this coin.👍
Feel free to FOLLOW for for important updates for this coin and trading strategies.🏆
Would also like to know your thoughts! Remember this is not financial advice, however, it is an overview of what I am seeing in this coin's price action.
-Happy Trading
MoneyGrind

OXT Is Just Getting Warmed UpOverview
- Overall OXT has performed very well today but it still has a long way to go long-term. Let's start from the top!
Price Chart
- 1hr timeframe chart with the 20/50/200 MA's and price is currently inside a micro triangle, that's in a macro triangle
- Previously broke out of the 20-50MA range and now forming a micro triangle before hopefully continuing to the upside
- Closing the daily above $0.59 would be insanely bullish, above $0.55 still bullish
- In time expect to hit the resistance line(green) of the macro triangle, meet/break $0.74, rise up to $0.84
- Remember this is a patient trade, OXT is like an upgraded saving's account :)
RSI
- On the RSI you'll see the channel OXT is currently in
- RSI is now on the lower part of the channel so it's getting more likely to see a rise in price action. (Although the higher the time-frame the more likely price will rise)
- In some cases the RSI will be too high on the bottom of the channel which causes a dump. This happens so the indicators can get reset so it can form another channel at lower values
4-Hour Chart
- Could see a short-term decrease in price so RSI value can get lower, still great structure
1-Day Chart
- Daily looks very bullish long-term
BTC Dominance
- Dominance is still showing signs of an alt season
If you enjoyed this analysis or learned something new, please LIKE this idea so more people can be aware of the possibilities of this coin.👍
Feel free to FOLLOW for for important updates for this coin and trading strategies.🏆
Would also like to know your thoughts! Remember this is not financial advice , however, it is an overview of what I am seeing in this coin's price action.
-Happy Trading
MoneyGrind

DING DING! Round Three Has Begun For OXTOverview
- Overall OXT is getting even more bullish being above the 20MA and Stoch activity. Let's start from the top!
Price Chart
- Chart is represented in the daily timeframe and is mixed in with the 20/50/200 MA lines. Lowest is green
- You'll also see two flag patterns, a micro(smaller) and macro(largest), break the macro and could see another run up to $0.74
- Would like to test the 20MA and then bounce up to higher prices. Break the macro flag and great things could happen
RSI
- RSI you will see the channel plotted with OXT in the makings of starting the third round up
- Expect to hit the green trend line on the next break up, if it does make contact, could also expect some selling
- It's normal to take longer before the next round begins and at this time we are currently longer than the second round RSI length
Stoch
- Before each round began, you'll see the stoch indicator quickly shoot up in the beginning. Current stoch value could be indicating that the third round is beginning
- When the next run occurs, would like to see an ascending pattern as that led to a 251% gain over time in the previous run(second)
Bitcoin Dominance
- The lower the value the better odds for an Alt Season to arrive. We also seen a break to the downside which is what we want to occur
If you enjoyed this analysis or learned something new, please like this idea so more people can be aware of the possibilities of this coin.👍
Feel free to follow for for important updates for this coin and trading strategies.🏆
Would also like to know your thoughts! Remember this is not financial advice , however, it is an overview of what I am seeing in this coin's price action.
-Happy Trading
MoneyGrind

OXT Starting To Show Bullish BehaviorOverview
- You may have noticed that I haven't been posting charts daily and that's mainly because there wasn't much to show. However, if you would like to know a mini analysis of what OXT could be doing, please let me in the comments! Now that we have broken, in my opinion, one of the two needed resistances, getting back above $0.53 is more likely. Let's start from the top!
Price Chart
- On the chart you'll see that we broke the resistance line of the triangle which is very bullish. You'll also see that be bounced from the 20MA which is the next resistance that needs to be broken in order to get to $0.53
- Quite simply, as long as we stay above the 50MA(yellow) it's bullish in my opinion
RSI
- RSI is showing an ascending channel which I have marked the possible line(Upper Green) the RSI could bounce off of in the future. Hopefully this is when we reach $0.53
MACD
- With the MACD we are showing signs of returning back to positive momentum with the Signal line(Blue) just barely above the MACD(red). We want to see the blue line over red because that indicates a bullish pattern
Again if you felt worried at all and want a mini analysis, please let me know! As always, if you enjoyed this analysis or learned something new, please like this idea so more people can be aware of the possibilities of this coin.👍
Feel free to follow for for important updates for this coin and trading strategies.🏆
Would also like to know your thoughts! Remember this is not financial advice , however, it is an overview of what I am seeing in this coin's price action.
-Happy Trading
MoneyGrind

OXT looks bullish
Found this pattern that might help when to expect ATH, maybe by end of March to the beginning of April.

OXT Cup and Handle! Easy MoneyBasic Cup and Handle formation! Buy now or wait till confirmation of breakout.

Not Gonna Lie, OXT's Daily looks REAL GOODOverview
- Been trying to find more data for you guys and came up with this on OXT's daily. Looks like it's ready for another run so let's start from the top!
Price Chart:
- Here on this daily chart you'll see three ranges that I have highlighted, all which first started on the bottom of the RSI channel line
- First section took 19 days to reach the highest RSI before returning back to the base line. Breakout of 87.19%
- Second section took 43 days to reach the highest RSI before returning to the base line. Breakout of 251.54%
- Now the section we could potentially create in the future. By using the formula presented on the chart (Read that before continuing), I was able to make a prediction of where the next move could be. This predicted move would take 97 Days to complete and end with a 725.68% breakout towards reaching a new ATH
- This is no guarantee as we only compared the pattern between the first and second sections and would be more accurate with a known third section
- Also very possible that OXT could never break $2 this cycle so don't use this prediction as your end new exit plan. Was only based off the first and second section
RSI:
- You probably could tell this part yourself by now but what is indicated in the RSI indicator is a channel made from the lows and highs of previous RSI's
- At the start of the third wave we are no where near overbought so there is plenty of room to expand
- Also possible that we bounce of the bottom for a while before returning back to retest $0.74. If this is broken expect great things
Additional
- If resistance is too strong we could possibly see a breakdown which could support a coming ALT SEASON. Even though some altcoins have already had awesome price action
If you enjoyed this analysis or learned something new, please like this idea so more people can be aware of the possibilities of this coin.👍
Feel free to follow for for important updates for this coin and trading strategies.🏆
Would also like to know your thoughts! Remember this is not financial advice , however, it is an overview of what I am seeing in this coin's price action.
-Happy Trading
MoneyGrind

OXT Must Break Through This Resistance To Get Closer To ATHOverview
- In this idea we'll talk about where OXT could be heading up next due to breaking it's channel. Still very bullish so let's start from the top!
Price Chart
- Added a new curved channel that has been useful in showing the last low. Since then we have broken outside the channel and now headed towards the 20MA where we could see a bounce off of or break through. If this occurs and the momentum continues, we could be going back up to the green line back to test $0.74 for a third time in hopes of getting closer to ATH
- We first need to break past $0.50
RSI
- Still showing similar RSI pattern that occurred before the previous breakout to ATH.
- RSI was also reset and now can continue making an ascending pattern that hopefully leads to another bullish run
MACD
- Positive momentum is starting to look promising as the MACD line is strongly over the Signal line.
If you enjoyed this analysis or learned something new, please like this idea so more people can be aware of the possibilities of this coin.👍
Feel free to follow for for important updates for this coin and trading strategies.🏆
Would also like to know your thoughts! Remember this is not financial advice , however, it is an overview of what I am seeing in this coin's price action.
-Happy Trading
MoneyGrind

OXT possible price action not financial advice. this is what I see playing out over the next month or so


Cup n handle from august until nowForgive me for the messy white lines.
The yellow lines say it all. Cup and handle formation
Cup depth measured, added to the break out of the handle
Breakout would zone be around .77-.80 cents
Possible Price continuation to $1 and beyond.
Wouldnt be able to say when exactly
bottom support of the handle is around .43- .45 cents
I’d definitely say it’s bottomed and we should see further movement upward
Btc dominance has dropped
alt coin correction is completing
I believe there is a orchid investment meeting on the 2nd or 3rd week of March that may also help the price go up. Good luck comment your thoughts below

OXT Resting Before The Long Hike UpOverview
- Overall I remain bullish as BTC could be resetting for another bull run which would be great news for OXT. Let's start from the top!
Price Chart
- Price is in a decline, however, we have been holding above the 50MA(Yellow) at most times which is nice to see
- Would like to stay above the 50MA other wise it is possible that we could be seeing the next MA(Red). I think this is unlikely as BTC would need need to drop lots more while also ending it's current bullish run
- Next resistance is the 20MA(Green)
- $0.42 is a nice support area behind the 50 MA(Yellow)
- Really believe OXT will rocket in the coming future but the question is when. Predicting this will be very difficult but once more volume comes in, expect something big
RSI
- Could be forming a double bottom on the RSI, which if confirmed, will lead to higher prices and maybe an ATH
- Double bottom pattern would be broken if the RSI touched down again at the same low-levels as the previous two lows
- We are still similar in RSI movement compared to the time-frame before the ATH breakout occurred
- Hopefully this is correct in the future
If you enjoyed this analysis or learned something new, please like this idea so more people can be aware of the possibilities of this coin.👍
Feel free to follow for for important updates for this coin and trading strategies.🏆
Would also like to know your thoughts! Remember this is not financial advice , however, it is an overview of what I am seeing in this coin's price action.
-Happy Trading
MoneyGrind


OXT... Alt Season build up?It looks good, but it's a shit coin. Tread with caution. Not financial advice.