OXT - A confirmed Breakout for LONG Trade#OXT/USDT Analysis
Description
---------------------------------------------------------------
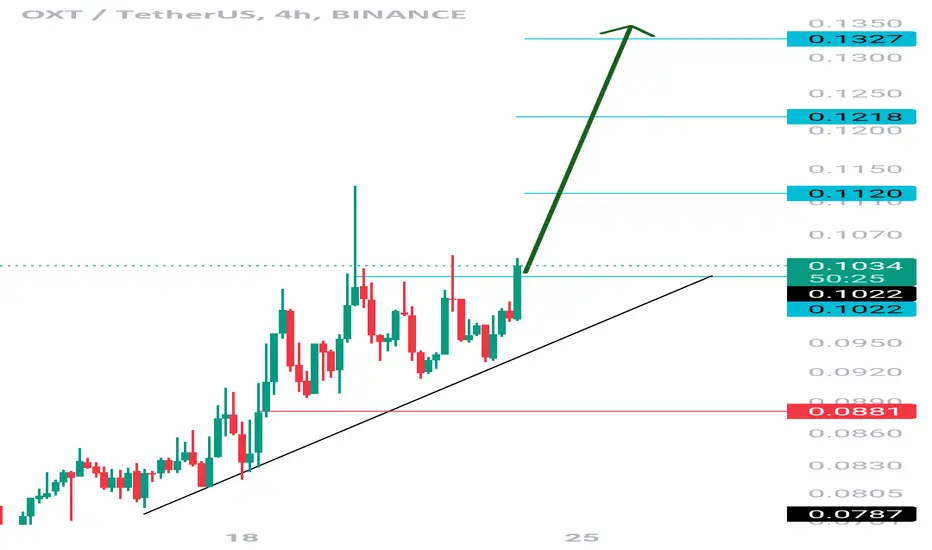
+ As you can see in the 1 Day chart, OXT is showing clear confirmation of breakout from the resistance and currently trade around the resistance zone.
+ i'm seeing this as a good chance to enter a long trade with a nice profit chance.
+ i'm keeping the stoploss around the support zone as the price can get rejected from the resistance.
---------------------------------------------------------------
VectorAlgo Trade Details
------------------------------
Entry Price: 0.1208
Stop Loss: 0.0822
------------------------------
Target 1: 0.1503
Target 2: 0.1807
Target 3: 0.2392
Target 4: 0.2909
Target 5: 0.3639
------------------------------
Timeframe:
Capital: 1-2% of trading capital
Leverage: 5-10x
---------------------------------------------------------------
Enhance, Trade, Grow
---------------------------------------------------------------
Agree or Disagree with the ideas ? lets discuss in the comments.
Like and follow us for more ideas.
Best Regards,
VectorAlgo
OXTUSDT trade ideas


OXT.X Price Prediction, Orchid cryptocurrency AI RecommendationsNew Robot factory from Tickeron Trading Results for last 12 months
OXT.X
AI Robots (Signals Only)
AI Robot's Name P/L
Day Trader: Crypto Pattern Trading in High-Volatility Markets (TA) 14.37%
Swing Trader: Advanced Crypto Pattern Trading (TA) 10.22%
Swing Trader: Crypto Pattern Trading at Trend Reversal Points (TA) 4.36%
Market Cap
The average market capitalization across the group is 95.73M. The market cap for tickers in the group ranges from 95.73M to 95.73M. OXT.X holds the highest valuation in this group at 95.73M. The lowest valued company is OXT.X at 95.73M.
High and low price notable news
The average weekly price growth across all stocks in the group was 3%. For the same group, the average monthly price growth was -4%, and the average quarterly price growth was 72%. OXT.X experienced the highest price growth at 3%, while OXT.X experienced the biggest fall at 3%.
Volume
The average weekly volume growth across all stocks in the group was -64%. For the same stocks of the group, the average monthly volume growth was -78% and the average quarterly volume growth was -92%

OXT.X in upward trend: price rose above 50-day moving average onOXT.X moved above its 50-day moving average on January 29, 2024 date and that indicates a change from a downward trend to an upward trend. In 33 of 41 similar past instances, the stock price increased further within the following month. The odds of a continued upward trend are 80%.
Price Prediction Chart
Technical Analysis (Indicators)
Bullish Trend Analysis
The Momentum Indicator moved above the 0 level on January 27, 2024. You may want to consider a long position or call options on OXT.X as a result. In 78 of 113 past instances where the momentum indicator moved above 0, the stock continued to climb. The odds of a continued upward trend are 69%.
The Moving Average Convergence Divergence (MACD) for OXT.X just turned positive on January 27, 2024. Looking at past instances where OXT.X's MACD turned positive, the stock continued to rise in 39 of 56 cases over the following month. The odds of a continued upward trend are 70%.
Following a +10.05% 3-day Advance, the price is estimated to grow further. Considering data from situations where OXT.X advanced for three days, in 201 of 284 cases, the price rose further within the following month. The odds of a continued upward trend are 71%.
OXT.X may jump back above the lower band and head toward the middle band. Traders may consider buying the stock or exploring call options.
The Aroon Indicator entered an Uptrend today. In 99 of 162 cases where OXT.X Aroon's Indicator entered an Uptrend, the price rose further within the following month. The odds of a continued Uptrend are 61%.
Bearish Trend Analysis
The 10-day RSI Indicator for OXT.X moved out of overbought territory on January 03, 2024. This could be a bearish sign for the stock. Traders may want to consider selling the stock or buying put options. Tickeron's A.I.dvisor looked at 32 similar instances where the indicator moved out of overbought territory. In 21 of the 32 cases, the stock moved lower in the following days. This puts the odds of a move lower at 66%.
The Stochastic Oscillator may be shifting from an upward trend to a downward trend. In 25 of 50 cases where OXT.X's Stochastic Oscillator exited the overbought zone, the price fell further within the following month. The odds of a continued downward trend are 50%.
The 10-day moving average for OXT.X crossed bearishly below the 50-day moving average on January 21, 2024. This indicates that the trend has shifted lower and could be considered a sell signal. In 7 of 15 past instances when the 10-day crossed below the 50-day, the stock continued to move higher over the following month. The odds of a continued downward trend are 47%.
Following a 3-day decline, the stock is projected to fall further. Considering past instances where OXT.X declined for three days, the price rose further in 50 of 62 cases within the following month. The odds of a continued downward trend are 54%.
BINANCE:OXTUSDT
Market Cap
The average market capitalization across the group is 93.64M. The market cap for tickers in the group ranges from 93.64M to 93.64M. OXT.X holds the highest valuation in this group at 93.64M. The lowest valued company is OXT.X at 93.64M.
High and low price notable news
The average weekly price growth across all stocks in the group was 8%. For the same group, the average monthly price growth was -13%, and the average quarterly price growth was 84%. OXT.X experienced the highest price growth at 8%, while OXT.X experienced the biggest fall at 8%.
Volume
The average weekly volume growth across all stocks in the group was -42%. For the same stocks of the group, the average monthly volume growth was -73% and the average quarterly volume growth was -35%

OXT SPOT SIGNAL WEEKLYHello dear traders,
In the OXT cryptocurrency on the weekly timeframe, with the breaking of the trend line and the current market conditions in the crypto market, we can expect a significant price growth in this currency. It can be said that this currency can be considered as a spot investment.
Thank you for your support. May you have a joyful and profitable journey.

OXT / USDT - Bearish SignsShow some strong signs:
1: 200 moving average break down
2: VWAP break down
3: 0.0932 resistance level break and retest
if price continue down
Target
1. 0.0875
2. Daily 200 moving average red line
3. 0.0758

OXT/USDT Gearing up for the Next Bull Run? 👀🚀OXT Analysis💎 Paradisers, focus your attention on OXTUSDT, as it exhibits notable market dynamics. The asset is signaling a potential bullish trend from an essential support level.
💎 Recently, Orchid faced a challenge at the $0.1135 resistance mark. If OXT can maintain stability at the key support level of $0.0794, there's a possibility we could see a continuation of its bullish trend.
💎This positive prospect is reinforced by OXT's strong showing above the EMA, indicating a likelihood of ongoing upward movement from this level of support.
💎 On the other hand, should OXT find it challenging to hold its position at the $0.0794 support, it may be time to consider an alternative approach. In such a case, we might need to anticipate a downward movement beginning from a lower demand zone. A significant point to watch is if OXT falls below this support level, as it could signal a shift to a bearish trend.
💎 Stay vigilant and proactive, Paradisers. Your ParadiseTeam is dedicated to providing you with the crucial insights needed to navigate these market trends, ensuring your trading choices are both informed and tactically sound.

$OXT breaks out of 141-week Down Trend - Very Bullish TechnicalsRefer to Fib levels:
- Next levels to watch out for are:
20c
33c
44c
etc..
I predict these levels will be reached quite rapidly in the coming 12-16 weeks and once break above Fib 1.0 occurs massive Bullish upside once we are above 20c ( 1000-2000% )
- Listed on every major exchange with USD/BTC pairs.
- Working product / Consumer product / Already has customers /Makes money etc
- Excellent team
- Excellent Technicals
- Solid Narrative
Please do your own research.

OXT ANALYSIS (4H)The MAV symbol has a bullish structure and we see higher H's and L's.
Under the candles in the recent data, a liquidity pool has formed which may break soon.
The green range is a good place for buy/long.
If it reaches the green range, we enter the buy/long position. Do not use this analysis as a sell/short setup
For risk management, please don't forget stop loss and capital management
When we reach the first target, save some profit and then change the stop to entry
Comment if you have any questions
Thank You

OXT/USDT Had a Good Run | What's Next for OXT?💎 Paradisers, focus your attention on OXTUSDT, as it exhibits notable market dynamics. The asset is signaling a potential bullish trend from an essential support level.
💎 Recently, Orchid faced a challenge at the $0.1135 resistance mark. If OXT can maintain stability at the key support level of $0.0794, there's a possibility we could see a continuation of its bullish trend.
💎This positive prospect is reinforced by OXT's strong showing above the EMA, indicating a likelihood of ongoing upward movement from this level of support.
💎 On the other hand, should OXT find it challenging to hold its position at the $0.0794 support, it may be time to consider an alternative approach. In such a case, we might need to anticipate a downward movement beginning from a lower demand zone. A significant point to watch is if OXT falls below this support level, as it could signal a shift to a bearish trend.
💎 Stay vigilant and proactive, Paradisers. Your ParadiseTeam is dedicated to providing you with the crucial insights needed to navigate these market trends, ensuring your trading choices are both informed and tactically sound.

Orchid (OXT)On the above 8-day chart price action has corrected by 95% since the sell signal (will show elsewhere). Today is great long opportunity. Why?
1) RSI and price action resistance breakout.
2) Multiple oscillators print bullish divergence across a 3-month period.
3) Seller weakness. Notice the long candle wicks into seller territory?
4) Price action prints support on past resistance since breakout. Look left.
Is it possible price action falls further? Sure.
Is it probable? No.
Ww
Type: trade
Risk: <=6% of portfolio
Timeframe: Now, don’t sit on your hands.
Return: Will say elsewhere.

Oxt Technically So Amazing Oxt/USDT is showing promising signs. It looks like it's gearing up for a bullish move, and I anticipate the price to increase by 15-30% in the coming days. However, it's important to note that this is not financial advice, so please do your own research (DYOR) before making any decisions.
OXT end of cicleOXT end of cicle,
ABC, 1.618 fib extension, expecting a move to the upside to test supply aroun 0.10, and major target around 0.20.
NFA

Oxtusdt Buy opportunityOXTUSDT's downtrend is evolving in the form of a potential ABC corrective wave, complete with a 5-leg structure in waves B-C. The BAOI region on the chart stands out as an ideal accumulation area. Immediate focus should be on our Anticipating BOS area; a Break of Structure here could set the stage for a test of the Unmitigated Supply Area. Don't forget to set an appropriate stop-loss, and we value your comments and likes on this post.

OXT after a long timeWe received a buy print in OXT after a long time. Expecting massive gains.
DYOR.

#OXT/USDT - Long - Potential 28.36%
Strategy: Long
Exchange: BINANCE
Account: Spot
Entry mode: Market order in range
Invest: 2.5%
Exit:
Target 3 : 0,0973
Target 2 : 0.0864
Target 1 : 0.0819
Entry: 0.0761
Stop: 0.0671
Technical indicators:
-Uptrend (fast MA's over slow) into breakout (white trendline broken)
-At support

OXTUSDT Looking to explode soonDownward channel movement on the long term, but we started to form kind of a bullish channel to the upside. Within this channel we have some sort of a symmetrical wedge formed with some liquidity hunts. This setup is still valid.

OXT/USDTThe Head and Shoulders pattern is a beneficial technical analysis tool for estimating the stock price movement from the neckline. It also shows a reversal trend when the market moves from a bullish trend to a bearish trend or a bearish trend to a bullish trend. This pattern will be one of the best patterns that guess a trend reversal. Finding this pattern can be helpful for the long term, and this is the best strategy used for trading

OXT/USDT TRADE SETUP!!Hello everyone, if you like the idea, do not forget to support it with a like and follow.
Welcome to this OXT/USDT Trade setup.
OXT looks good here. Breaks out from the symmetrical triangle. Currently, retesting the trendline. Long some here and add more in the dip.
Entry range:- $0.073-$0.076
Target1:- $0.086
Target2:- $0.098
Target3:- $0.112
Target4:- $0.134
SL:- $0.070
Buy on the spot or use low leverage.
If you like this idea then do support it with like and follow.
Thank You!

OXT-USDT - DAILYThese are my Keylevels for OXT.
Nothing do to here, i think that we need to wait for more confirmations.

OXT bearish retestOXT UPDATE: OXT Broke down the strong support both on daily and 4hrs TF…. Is looking to retest the 4hrs bearish OB above…. Can take a short from CMP without SL and wait for profit as indicated in the chat ….
Targets
0.05894
0.05387
0.05387
005044
004693
Manage your risk always and don’t be greedy….
Follow and chat me up for more free trade and market update

OXT Sell Trade. ACCORDING to My StudyWelcome to our crypto exploration hub! We're here to navigate the exciting world of digital assets, providing you with comprehensive insights into market dynamics and potential trading opportunities.Our mission is to decode the crypto market's mysteries and equip you with the knowledge you need to make informed investment choices. From the latest developments in Bitcoin to the hidden potential of various altcoins, we're your trusted source for daily technical analysis.While technical analysis is a valuable tool, it's important to remember that it's just one piece of the puzzle. We encourage you to take a well-rounded approach to your investments, considering factors like macroeconomic trends, news, and community sentiment.Join us for the freshest analyses, and don't hesitate to join the conversation in the comments below. Keep in mind that our content is purely for educational purposes and should not be construed as financial advice. Always integrate it into your broader investment strategy."

OXT has strong support zoneThe coin has formed several cascading support levels with many confirming touches, behind which unrealized liquidity has accumulated. There are also locally declining highs and trading volumes, which may indicate the weakness of buyers at the moment.
