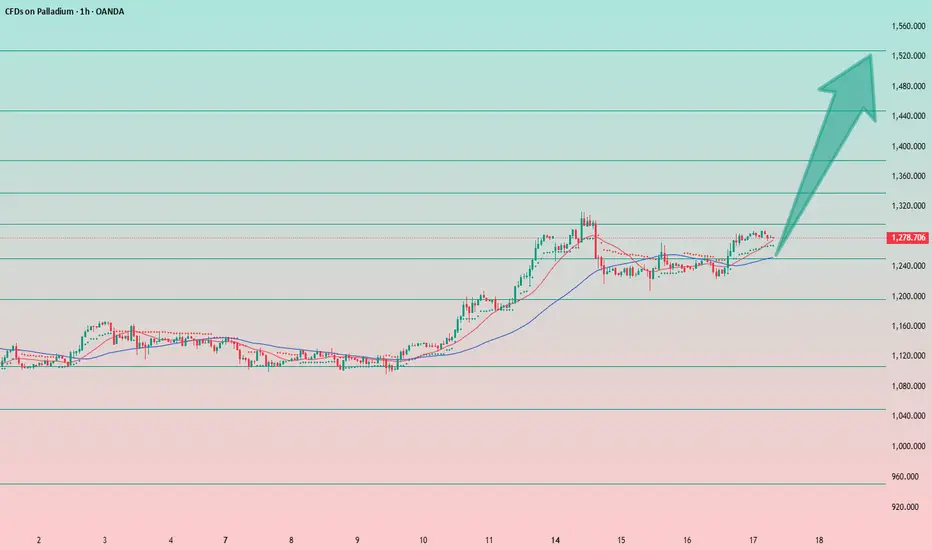
STRONG BUY | PALLADIUM Strategy: Impulse Correction
Direction: Bullish
Moving Average: Blue above Red
Fib Retracement: 38.2 reached
MACD > 0
Support : Finding additional confluence, as the weekly bounces off a massive support structure
1st Target = 1336
2nd Target = 1419
3rd Target = 1527
Lots: 0.2 (Plan to pyrami
About Palladium (XPDUSD)
Palladium has several special properties as a commodity. One of the most interesting aspects for traders in futures contracts is that palladium, despite its status as one of the main internationally traded precious metal commodities, has not seen a significant rise in price, as opposed to other precious metals like gold or silver.
The market for palladium is large while the palladium price per ounce is currently comparatively low, which is an enticing combination for those involved in commodity trading. Palladium is also different to gold in terms of investment, in that prices of gold usually rise when the economy is in a slump. Palladium price charts will show that the opposite is true of the palladium price - it decreases when the economy is down.
More than 80% of all palladium in the world is mined in South Africa and Russia.

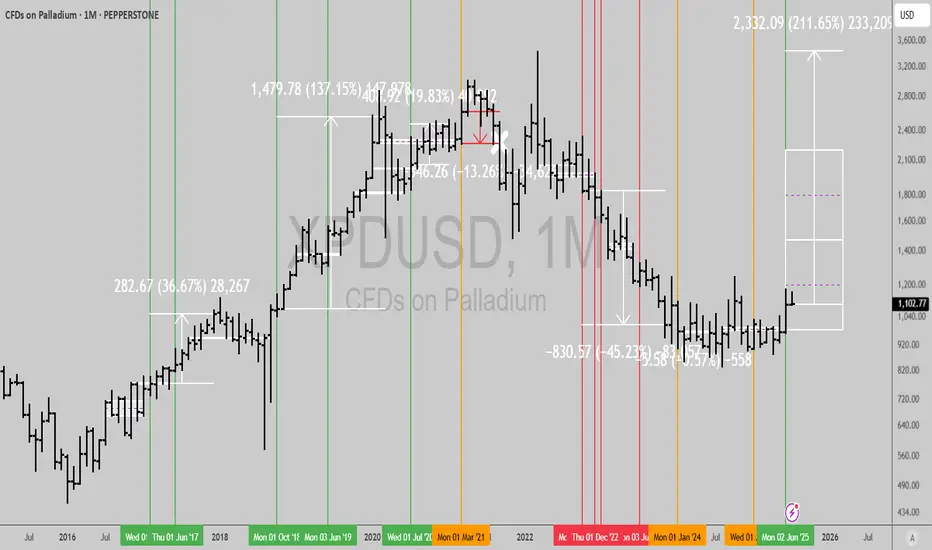
Palladium Fractal ReboundPalladium Quarterly Chart Analysis: Cycles, Technicals, and Outlook
Introduction
Palladium prices have undergone a dramatic collapse and partial recovery in recent years. From record highs in 2021–2022, the metal fell by over 60% (roughly a 63% drawdown at worst), echoing the severe crash witnessed

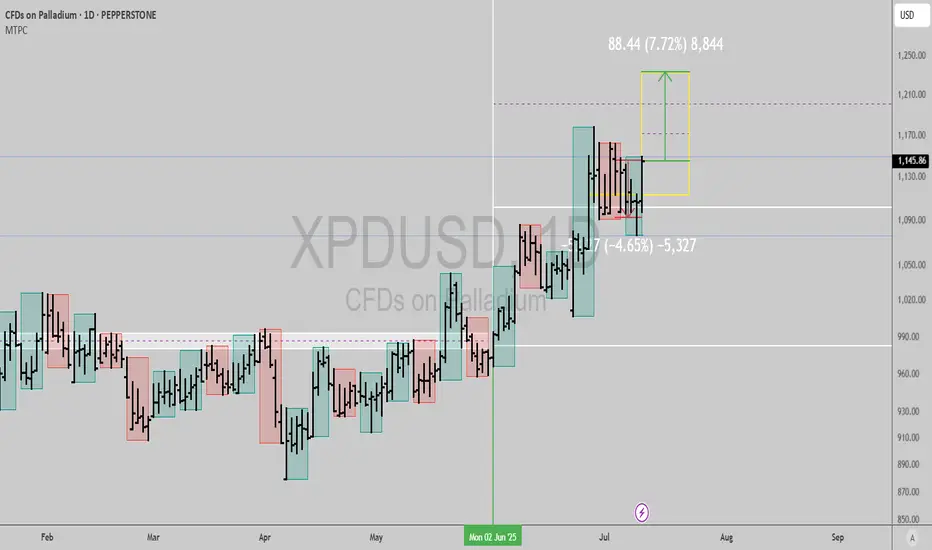
Palladium: Bullish Structure IntactThe long setup remains valid.
The structure on the daily, weekly, and monthly charts is clearly bullish, and I expect the uptrend to continue.
Entering from the current level is tricky, as the stop-loss would need to be placed below the local low — around the 1200 area.
A better approach would be
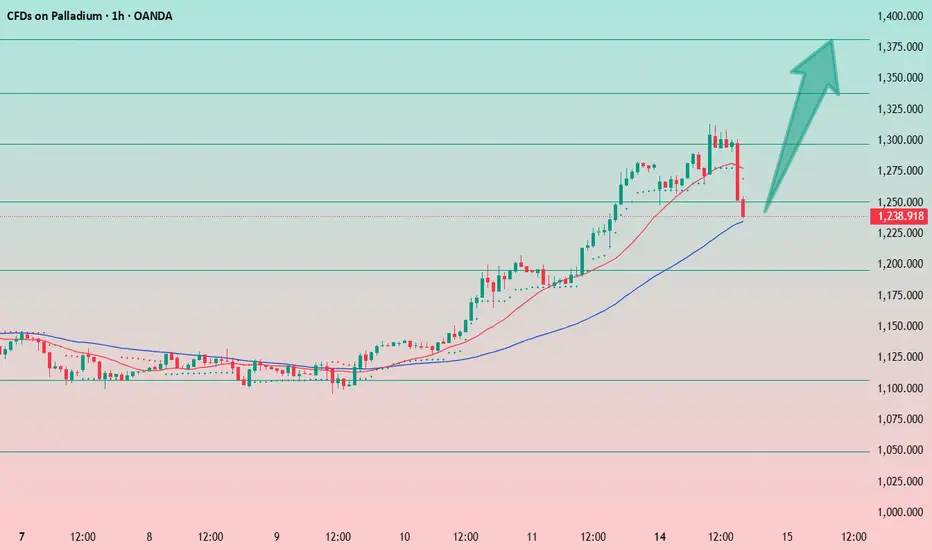
Palladium Pullback Offers Long Opportunity Amid UptrendPalladium has undergone a solid correction.
The bullish factors remain in place. I believe the current level is acceptable for entering a long position, with a stop at 1230.
If the stop is hit, we’ll need to reassess further long opportunities.
No shorts on metals — only longs for now! The market
$XPDUSD: Daily trend continuation signalMonthly trend is active, daily now suggests momentum to the upside is intact...
Best of luck!
Cheers,
Ivan Labrie.
Palladium bottomed?Long term signal flashing in OANDA:XPDUSD here, wonder what it entails?
Bottom in ICE vehicle demand?
Some shortage I'm not aware of?
Leave your comments below...
Best of luck!
Cheers,
Ivan Labrie.
Palladium / USM2 Spread: Breaking out!Platinum and Palladium are breaking out of a multi year accumulation zone in respect of USM2 spread!
Using this channel, expect $3000- $10000 per ounce. Perhaps a hydrogen vehicle revolution could cause demand to spike?

Palladium Shows Strength — A Bullish OpportunityPalladium is beginning to show strong bullish momentum. I believe this is a good opportunity for those who haven’t entered yet.
A stop-loss can be placed at $1120, or better yet at $1090 — giving the trade a bit more room to move.
Target: $1250.
On a broader scale, platinum and palladium are t

PALLADIUM PRICE HIJACK! (XPD/USD Long Setup)🏦💰 PALLADIUM HEIST ALERT: XPD/USD Bullish Raid in Progress! (Long Setup) 💰🏦
🚨 Cops Waiting at Support? Here's How to Loot This Rare Metal Move! 🚨
🦹♂️ ATTENTION ALL MARKET BANDITS!
To the Elite Metals Raiders & Risk-Takers! 🔥💎
Using our 🔥Thief Trading Tactics🔥 (a lethal mix of supply shocks + indust

"Stealing Profits: XPD/USD Long Setup (Risk-Reward Heist)"🚨 XPD/USD "Palladium" Metal Market Heist Alert: The Bullish Breakout Robbery Plan (Swing & Scalp Strategy) 🚨
🌟 Hi! Hola! Ola! Bonjour! Hallo! Marhaba! 🌟
Attention Money Makers & Market Robbers! 🤑💰💸
Based on the 🔥Thief Trading Style🔥, here’s our master plan to loot the XPD/USD "Palladium" Metal Mar

See all ideas
Displays a symbol's price movements over previous years to identify recurring trends.