PENDLE/BTC Daily Chart Analysis | Momentum Building for the NextPENDLE/BTC Daily Chart Analysis | Momentum Building for the Next Move
🔍 Let’s dive into PENDLE/BTC and highlight the current technical landscape with key areas to watch for traders.
⏳ Daily Chart Overview
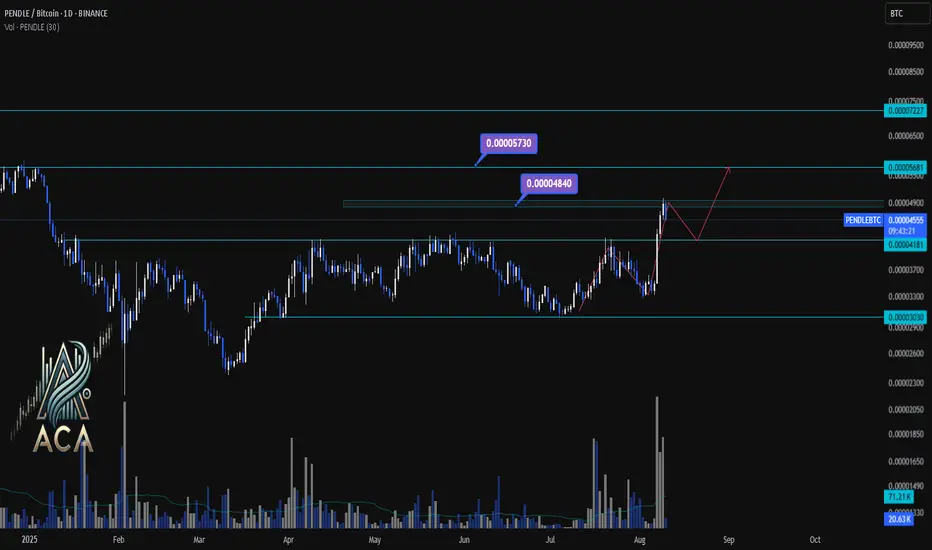
PENDLE/BTC recently broke above a multi-month resistance near 0.00004500, confirming strong bullish momentum on the daily timeframe. Volume surges are supporting this upward move, indicating increased market participation and renewed interest from buyers.
🔺 Bullish Scenario:
If the uptrend continues, look for a push toward the first target:
- 0.00004840 (major supply/target zone)
- On further strength, 0.00005730 is in sight as the next resistance.
Expect short-term consolidation or minor pullbacks before any strong breakout.
🔻 Bearish/Consolidation Scenario:
If sellers step in or the rally loses steam, support is found at:
- 0.00004181 (immediate level)
- If this breaks, look for deeper retracement toward 0.00003300 (structural support).
📊 Key Highlights:
- Daily breakout from a consolidation range signals bullish continuation potential.
- Volume spikes confirm genuine buyer interest at current levels.
- Major upside targets: 0.00004840 and 0.00005730.
- Critical downside supports: 0.00004181 and 0.00003300.
- Price action may oscillate (range/consolidate) between the support and resistance before a major move.
🚨 Conclusion:
Momentum favors bulls as long as price holds above 0.00004181. Watch for a confirmed breakout above 0.00004840 for additional upside. Stay nimble—volatility will likely provide both breakout and pullback opportunities.
Keep an eye on PENDLE/BTC and PENDLE/USDT📈📊
PENDLEBTC trade ideas
PENDLEBTC 1D Chart Analysis | Accumulation Breakout ConfirmedPENDLEBTC 1D Chart Analysis | Accumulation Breakout Confirmed
🔍 Technical Breakdown
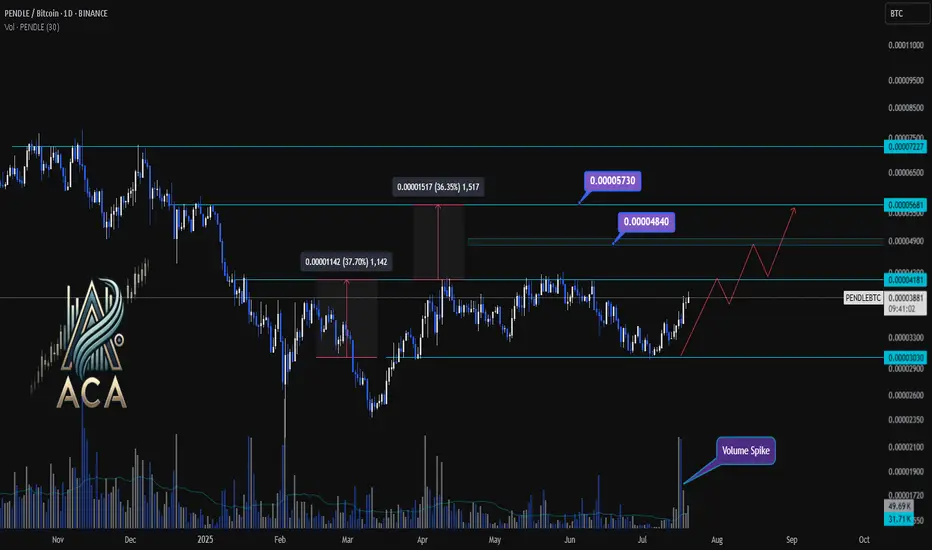
PENDLE/BTC has officially broken out above a key accumulation box, confirming strength as the daily candle closed above the 0.00004181 resistance zone. This marks a significant structural shift after months of sideways consolidation.
📈 Key Observations
Accumulation Phase: The prolonged sideways structure acted as a re-accumulation range. The recent breakout suggests strong hands absorbing supply before expansion.
Breakout Momentum: Prior rallies from this region resulted in +36% and +37% moves. Similar behavior is expected if this breakout sustains.
Target Zones:
🎯 First Target: 0.00004840 (mid-range resistance)
🎯 Extended Target: 0.00005730 (macro resistance)
📊 Volume Spike confirms genuine breakout demand. If BTC remains stable, PENDLE may repeat its historical rally patterns toward the upper resistance zones.
🚀 Conclusion
With a clean close above the range high and confirmed volume, PENDLE/BTC appears poised for further upside. Momentum traders may eye pullbacks into 0.00004180 as potential entries.
Crypto Trading Signal Nueva Trade!
PENDLE/BTC
Binance
Entry Level 0.0000324
StopLoss 0.0000307
Rating 4.5/5
Profit Target #1 : 0.0000338 (Take 50%)
Profit Target #2 : 0.0000348 (Take 25%)
Profit Target #3 : 0.0000353 (Take 25%)
When T1 reached: New Stop loss for remaining position moves to 0.0000310
When T2 reached: New Stop loss for remaining position is entry point 0.0000324

Pendle vs BTC updatePendle has one of the strongest charts vs. BTC in the entire market, this is why I have covered the token so widely. I do believe there is a base forming against BTC, this is marked in the dashed red. The weekly stochastic RSI is still bottoming, so we could see another rather large increase against BTC soon. I am still cautious as BTC did have some capitulation recently, this is one of my favorite tokens for the cycle.
